Data Visualization / Data Analysis
Visualizing Product Sales Insights - Amazon’s Marketplace
Uncovering Insights for Amazon’s Marketplace in the UK (2023)

Overview Description
I’m taking a look into the data from 2.2 million products sold on Amazon in the UK in 2023. While I’m not a part of Amazon, I’m putting myself in the shoes of a data-driven team within the company to explore insights that may be valuable for Amazon’s B2B (Business-to-Business) marketplace.My aim is to envision the kinds of insights that a data-savvy team within Amazon’s B2B sector might be interested in.
Research Question
“What insights can I gather that will help me provide valuable data to a B2B team on Amazon, enabling stakeholders and businesses to make informed decisions about top-selling products, successful categories, and highly-rated products?”
Methods & Process:
Data Acquisition
Data Preparation/Development
Data Manipulation
Data Query & Analysis
Data Visualization
Tools Used
Kaggle, Tableau, Excel
Data sourcing
To find the right dataset for my project, I carefully combed through Kaggle, sifting through datasets from various companies and profiles until I found one that met my criteria. I really wanted to focus on spending time analzying relevant and recent data that could be useful for indsutry data analysts. I ultimately chose to focus on finding sales and retail data for its broad relevance to diverse businesses, including everything from local shops to major retail chains and e-commerce platforms.
I spent extra time searching for a suitable dataset to minimize the effort needed during the next step, which involves data preparation.
I came across the Amazon UK Products Dataset for the year 2023, encompassing a vast array of 2.2 million products. This dataset was recently collected in October 2023, offering a comprehensive repository of pricing and sales data, which was an ideal fit for my analysis. My dataset had a usability score of 10, which is a metric calculated by Kaggle that indicates completeness, credibility and compatibility.
Data preparation
The dataset I used was relatively clean and didn't require extensive data cleaning or merging from different sources, so I only had to make minimal changes in this data preparation stage.My dataset was comprised of these 10 columns:
asin: Product ID from Amazon (Data Type: String)
title: Title of the product (Data Type: String)
imgUrl: URL of the product image (Data Type: String)
productURL: URL of the product (Data Type: String)
stars: Product rating. If 0, no ratings were found (Data Type: Float)
reviews: Number of reviews. If 0, no reviews were found (Data Type: Integer)
price: Buy now price of the product. If 0, price was unavailable (Data Type: Float, Currency: GBP)
isBestSeller: Whether the product had the Amazon BestSeller status or not (Data Type: Boolean)
boughtInLastMonth: Number of products sold last month according to Amazon (Data Type: Integer)
categoryName: Name of the category to which this product belonged (Data Type: String)
Data manipulation
I explored the option of adding new calculated fields, aggregations, and/or transformations to make the dataset more suitable for analysis. During this process, I decided to remove the variables imgUrl and productURL, as they didn’t serve me any purpose for my analysis.
To make the dataset more relevant, I introduced a new metric, ‘revenue,’ which is calculated by multiplying ‘price’ and ‘boughtInLastMonth’ together. This change provided a valuable key performance indicator (KPI) that quantifies the monetary value generated by each product.
Some limitations in this part of the analysis: The ‘revenue’ number I calculated, based on last month’s data, is limited because I don’t have sales data for each month (only for September). Along with that, I can’t estimate the yearly revenue regardless, due to the lack of data for the last part of the year (Q4) since this dataset was scraped just in the beginning of October.
As I worked on various visualizations, I revisited the data development and manipulation process, ensuring that the data was well-prepared to create the visualizations I needed for each step of the process.
As I began my exploratory data analysis, I decided to start with a treemap. They’re an excellent way of visualizing and gaining insights from large datasets, particularly when exploring variables like revenue.
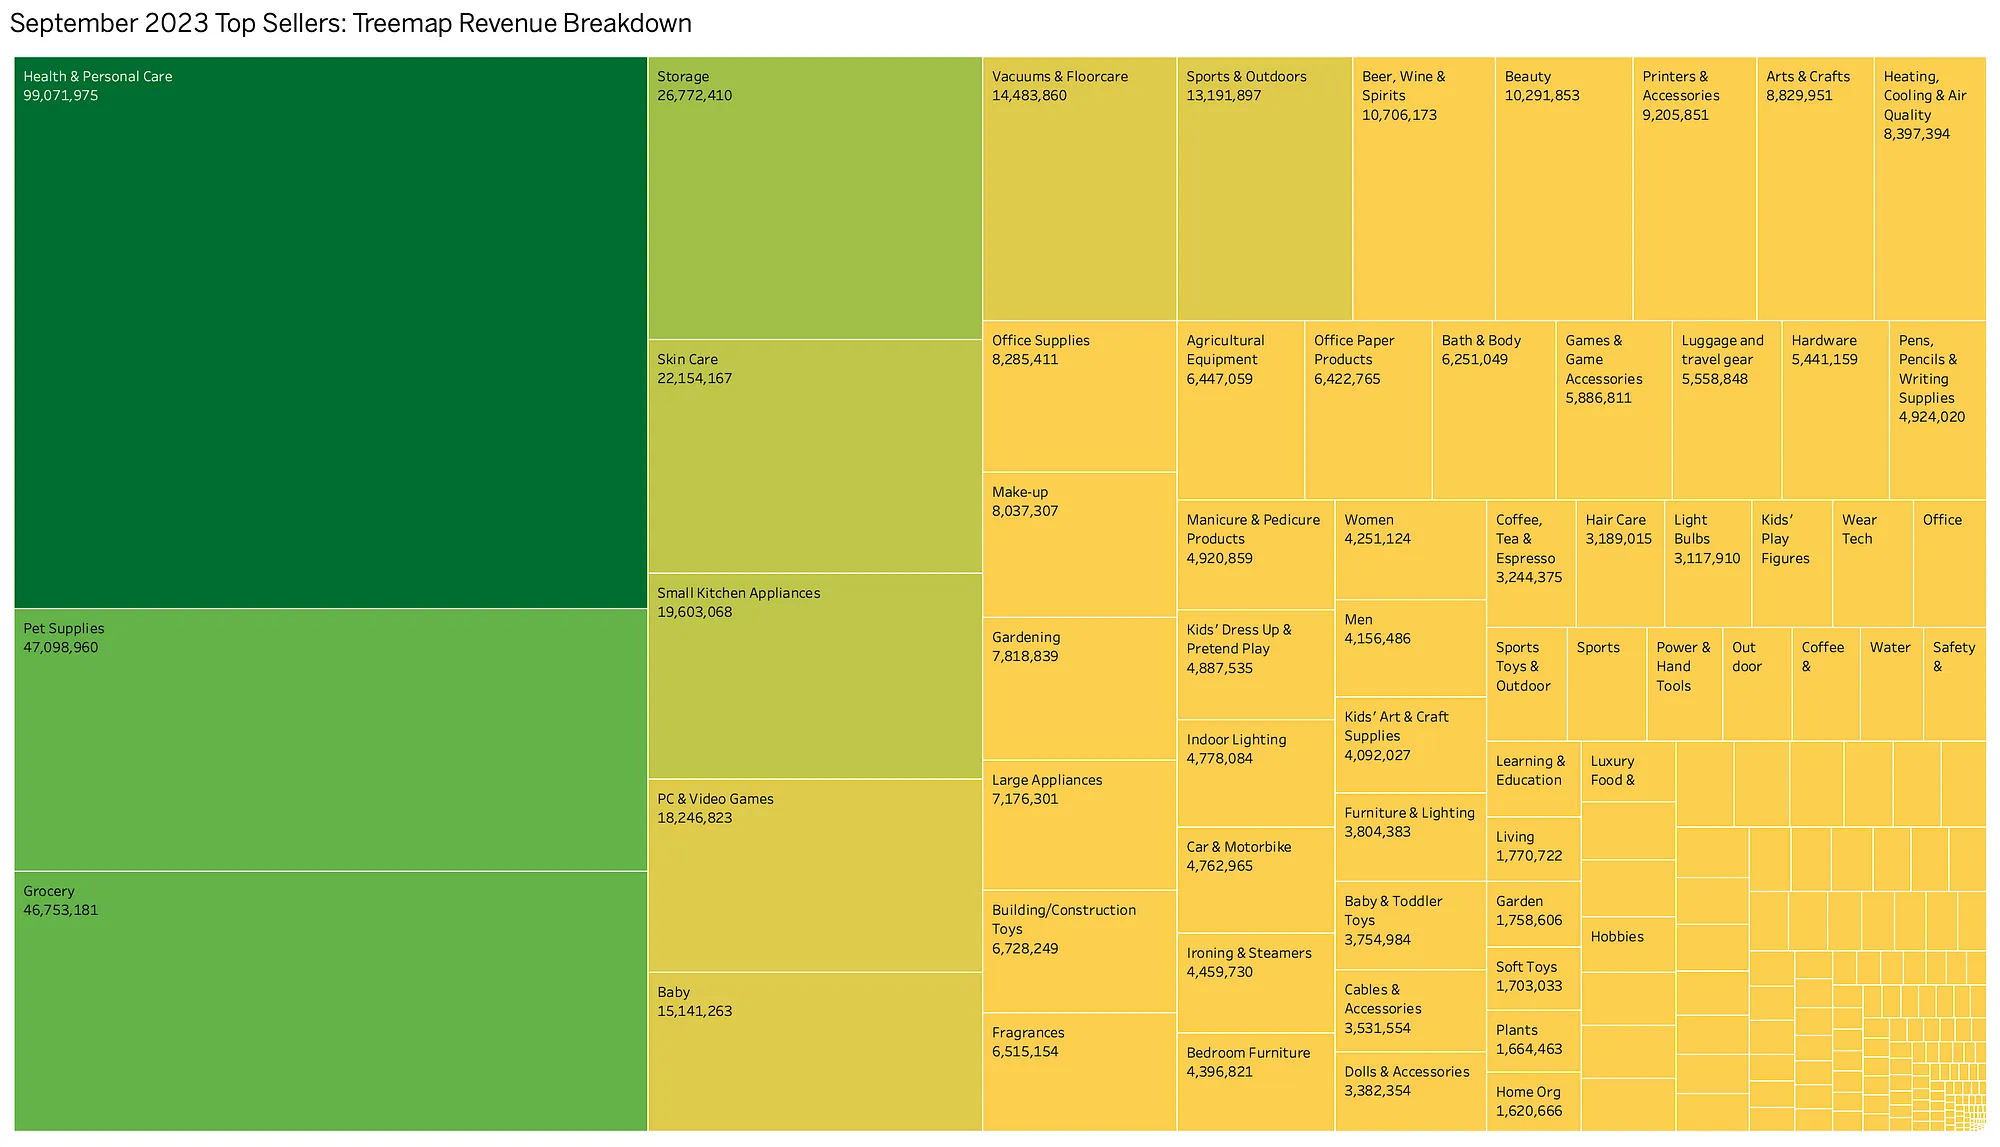
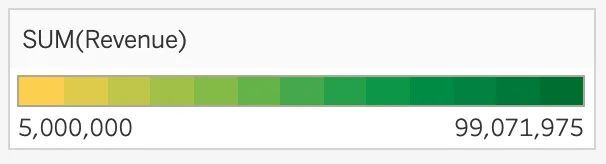
This visualization was useful at this stage of my analysis because the treemap was great for handling large datasets. It offered a clear and well-organized view, making it easy to explore various categories. By organizing the data by amount of sales from each group, I could dig into the revenue of Amazon’s top categories for September 2023. The varying box sizes made it simple to see how revenue was spread across different product categories. The color scheme I used helped compare revenue contributions from each category. The top selling categories (in order) were Health & Personal Care, Pet Supplies, Grocery, Storage, and Skincare. Smaller categories brought in around 5 million GBP per month, while top-performing categories, like Health & Personal Care, raked in around 99 million GBP each month.
I decided to focus on the largest revenue based category; Health & Personal Care.
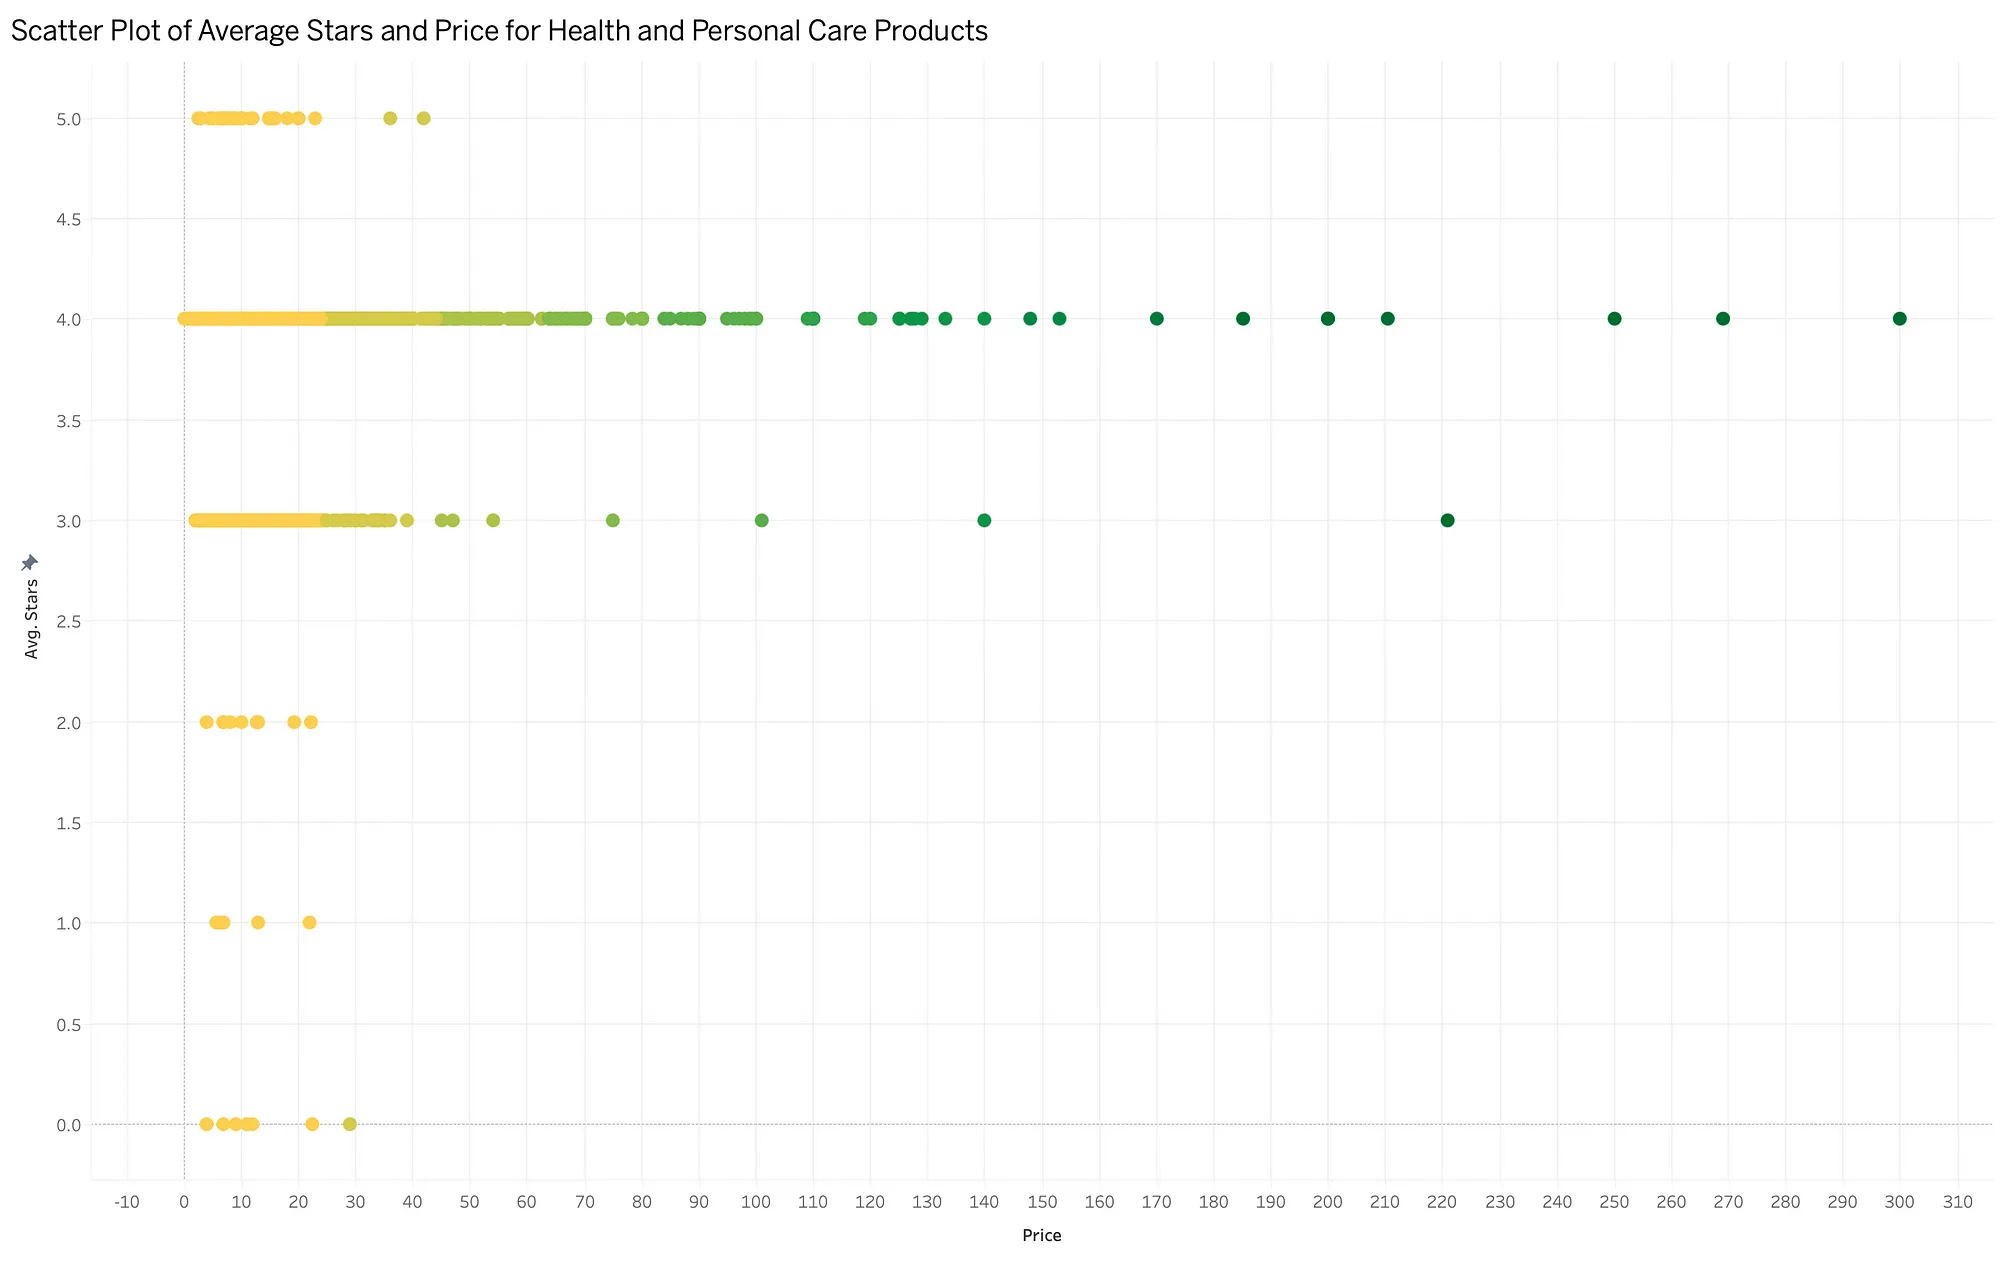
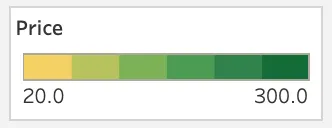
I created an intial scatterplot to visualize the distribution of products in the Health and Personal Care category based on their average star ratings and prices. This first scatterplot below displays the entire range of data, but due to the concentration of products on the lower end of the price axis, it was challenging to discern patterns in this region.
From an overview, the scatter plot showed that there is a diverse range of star ratings, including 0–2 star reviews, 3-star reviews, 4-star reviews (which were very common), and 5-star reviews. This indicates that customers’ opinions about products in this category vary widely.
There were also 8,216 products in total in the Health & Personal care category that contributed to its 99 million GBP revenue per month.
To gain a more detailed view of the products, I generated a second scatterplot, zoomed in on the data, and adjusted the price axis to a narrower range from 0 to 50 GBP. This allowed me to focus on the majority of products in the lower price range and gain deeper insights into their star ratings and prices. I implemented a price filter to monitor the number of items excluded within this refined range, and I updated the x-axis to reflect the narrowed price spectrum.
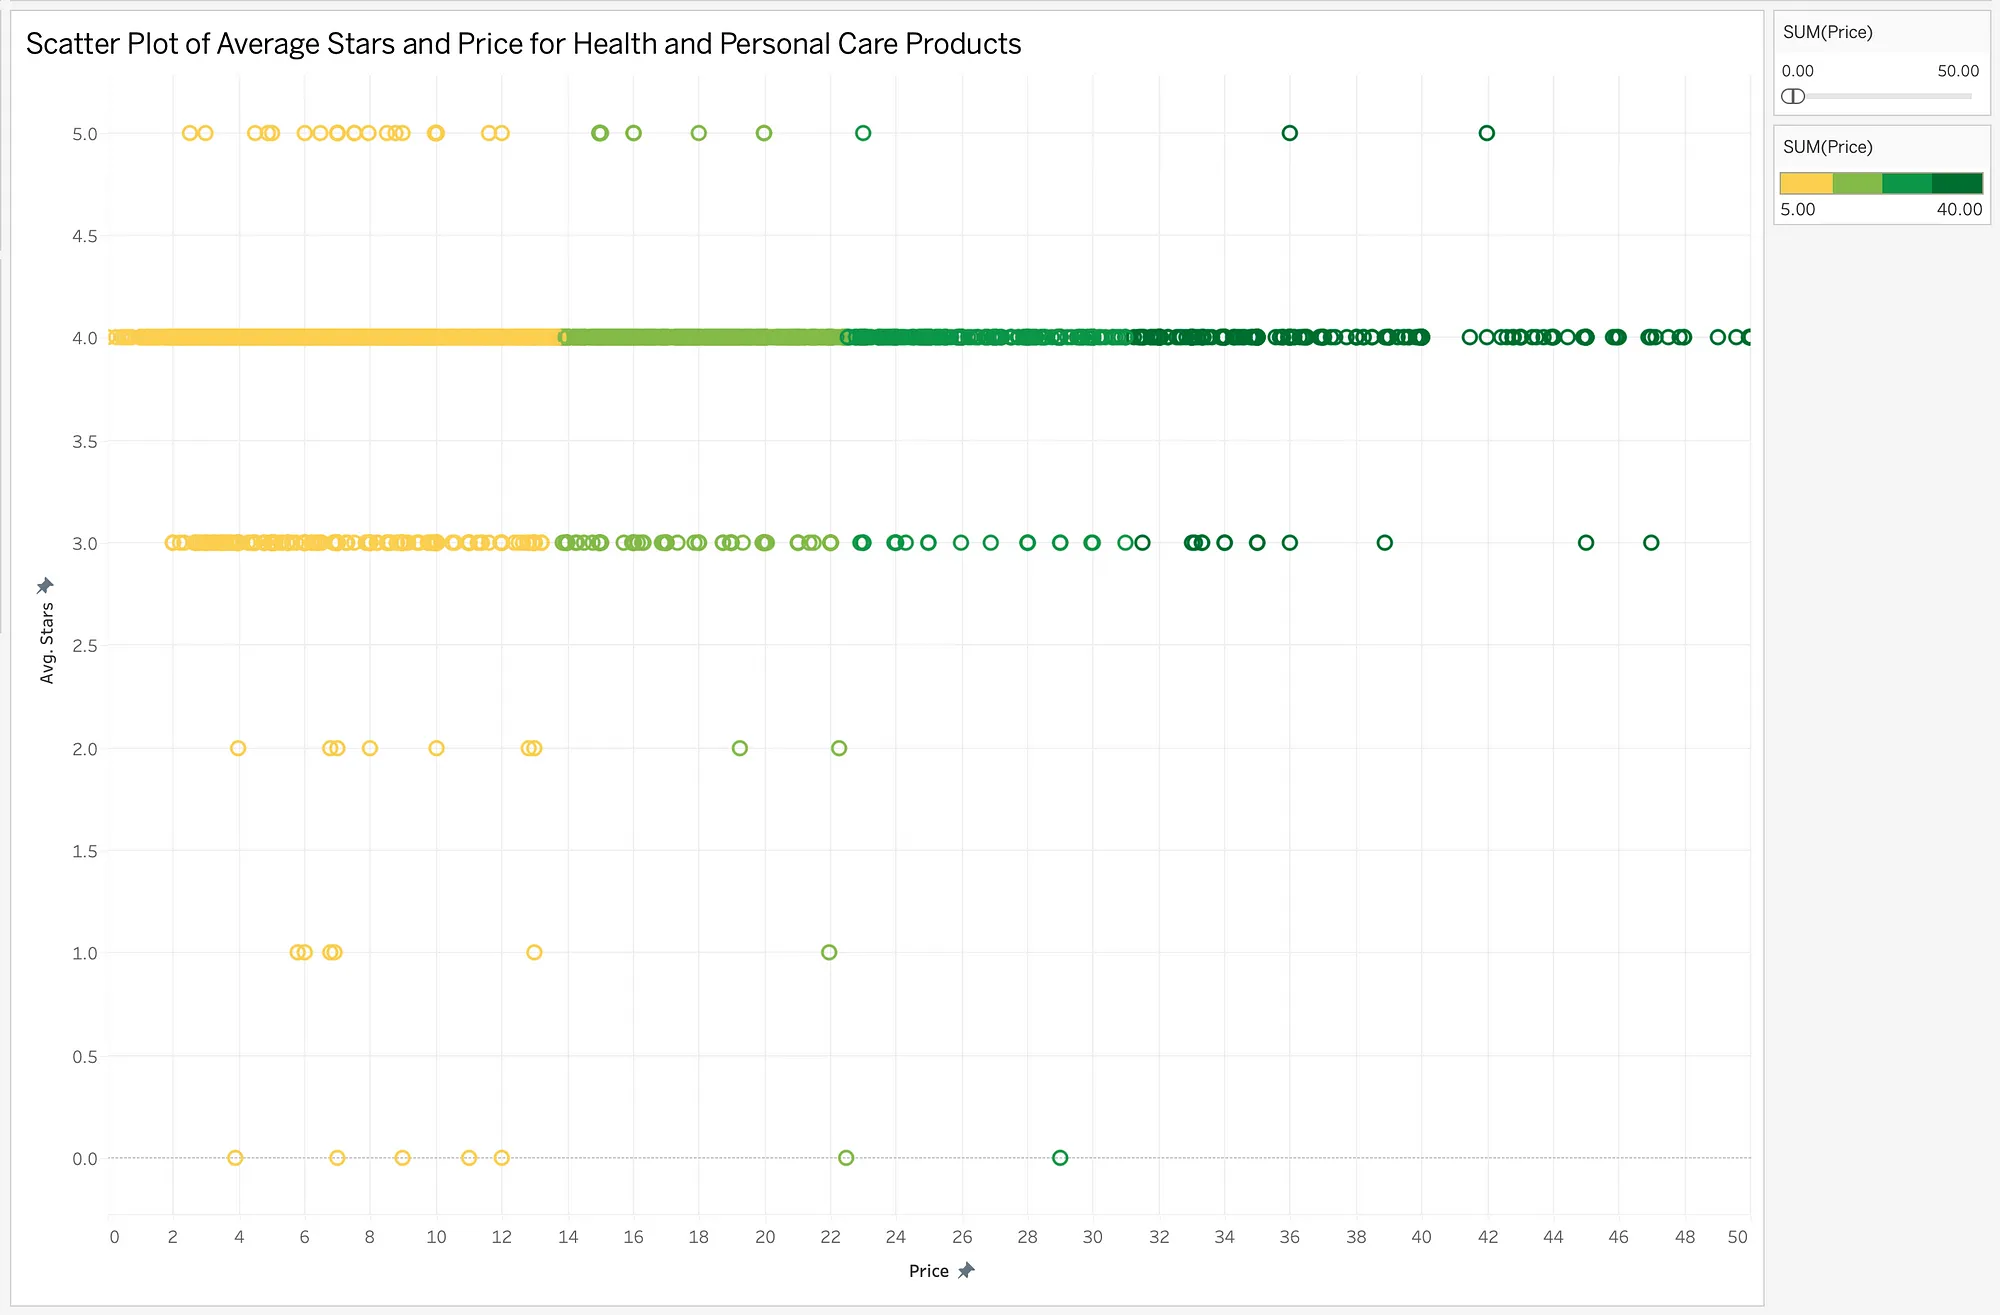
In this second scatter plot, where I focused on products in the 0–50£ price range within the health and personal care category, I identified 8,084 items. This observation revealed that a majority of purchases (approximately 98.4%) in this category are priced at 50£ and below, as 132 items priced between 50–320 GBP were excluded from the updated visualization. Many products fell under the 3 and 4 star rating. Most customers seemed to prefer products in this more affordable price bracket.
I decided on to continue with this exploration, trying to figure out what other insights I could uncover in this category.
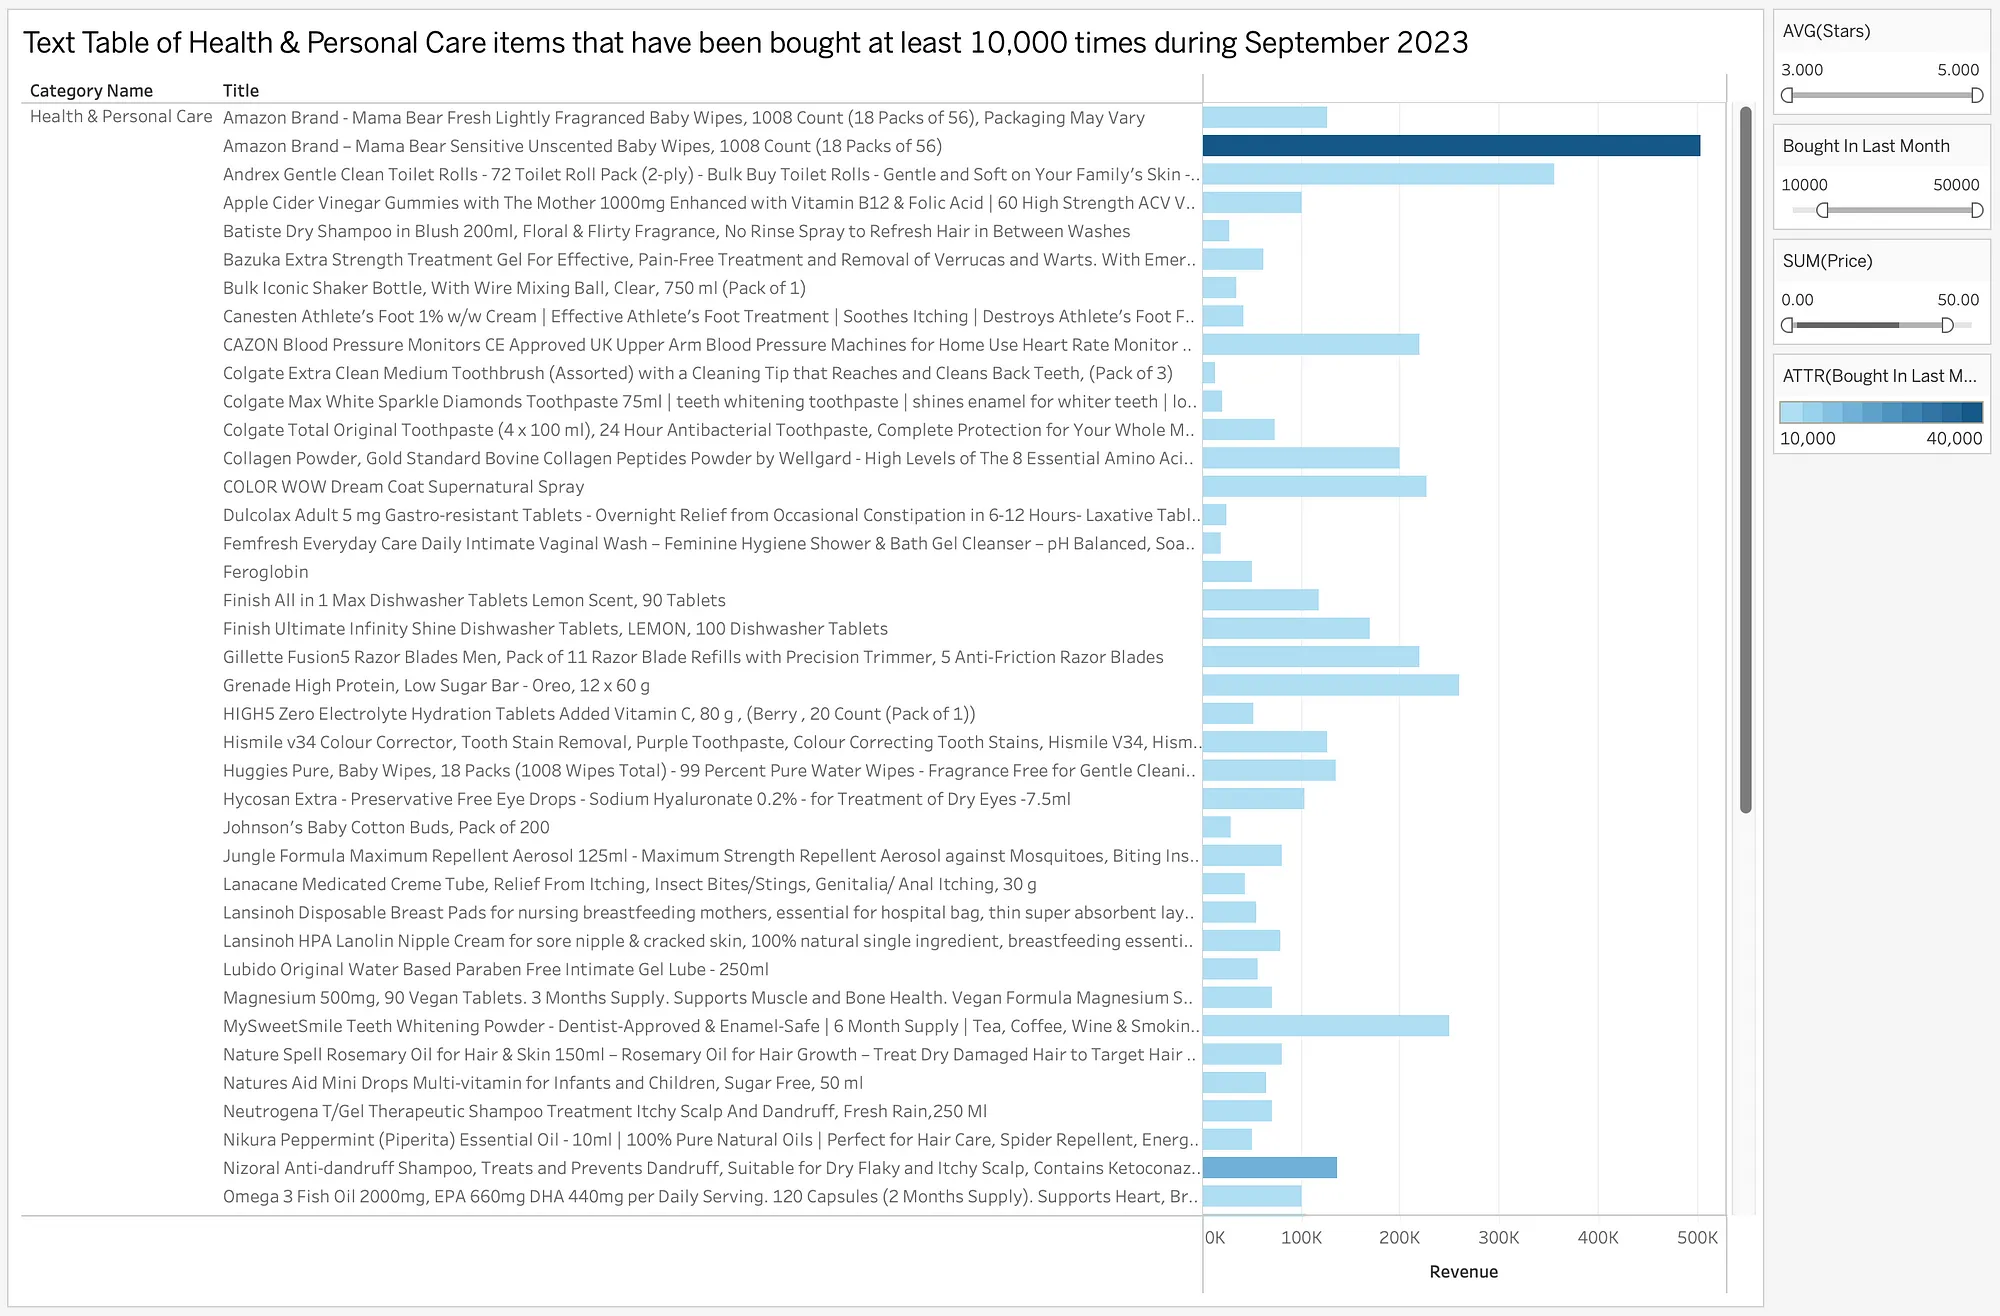
In the second scatter plot, I had already narrowed my focus to products in the price range of 0–50 GBP, providing an overview of the items within this budget-friendly segment. My next step involved introducing the variable ‘boughtinlastmonth’ to gauge the revenue generated by each product and to gain insight into the frequency of their purchases.
By setting a benchmark that only displays items with at least 10,000 monthly purchases, I refined the selection to a streamlined list of 61 products for my text table. These products have demonstrated significant sales and have contributed substantially to the category’s revenue. In the resulting text table, you’ll find each product along with a corresponding horizontal bar chart on the right, which depicts the revenue generated by the product.
I opted for a different color scheme in the text table because the previous ones were associated with showing price and revenue, whereas this new scheme is used to represent the frequency of product purchases in the month of September. Darker bars are indicative of items that have been in high demand, not only contributing significantly to revenue but also representing products that resonate with consumers.
The x-axis along the bottom right part of the text table provides a visual reference for revenue, ranging from 0k to 500k, aiding in the visual interpretation of each product’s financial impact within the category.
I intuitively experimented with the star rating filter to confirm that products rated 3 stars and above are already part of the category with sales of 10,000 or more.
Lastly, I transformed the text table into a descending bar graph, with the items generating the highest revenue and the most frequent purchases taking the lead near the y-axis. This chart showcases the top 61 products from the Health and Personal Care category that garnered at least 10,000 monthly purchases in September. Each of these products boasts a minimum 3-star rating and falls within the 0–50 GBP price range. These top 61 items are not only budget-friendly but also high in demand.
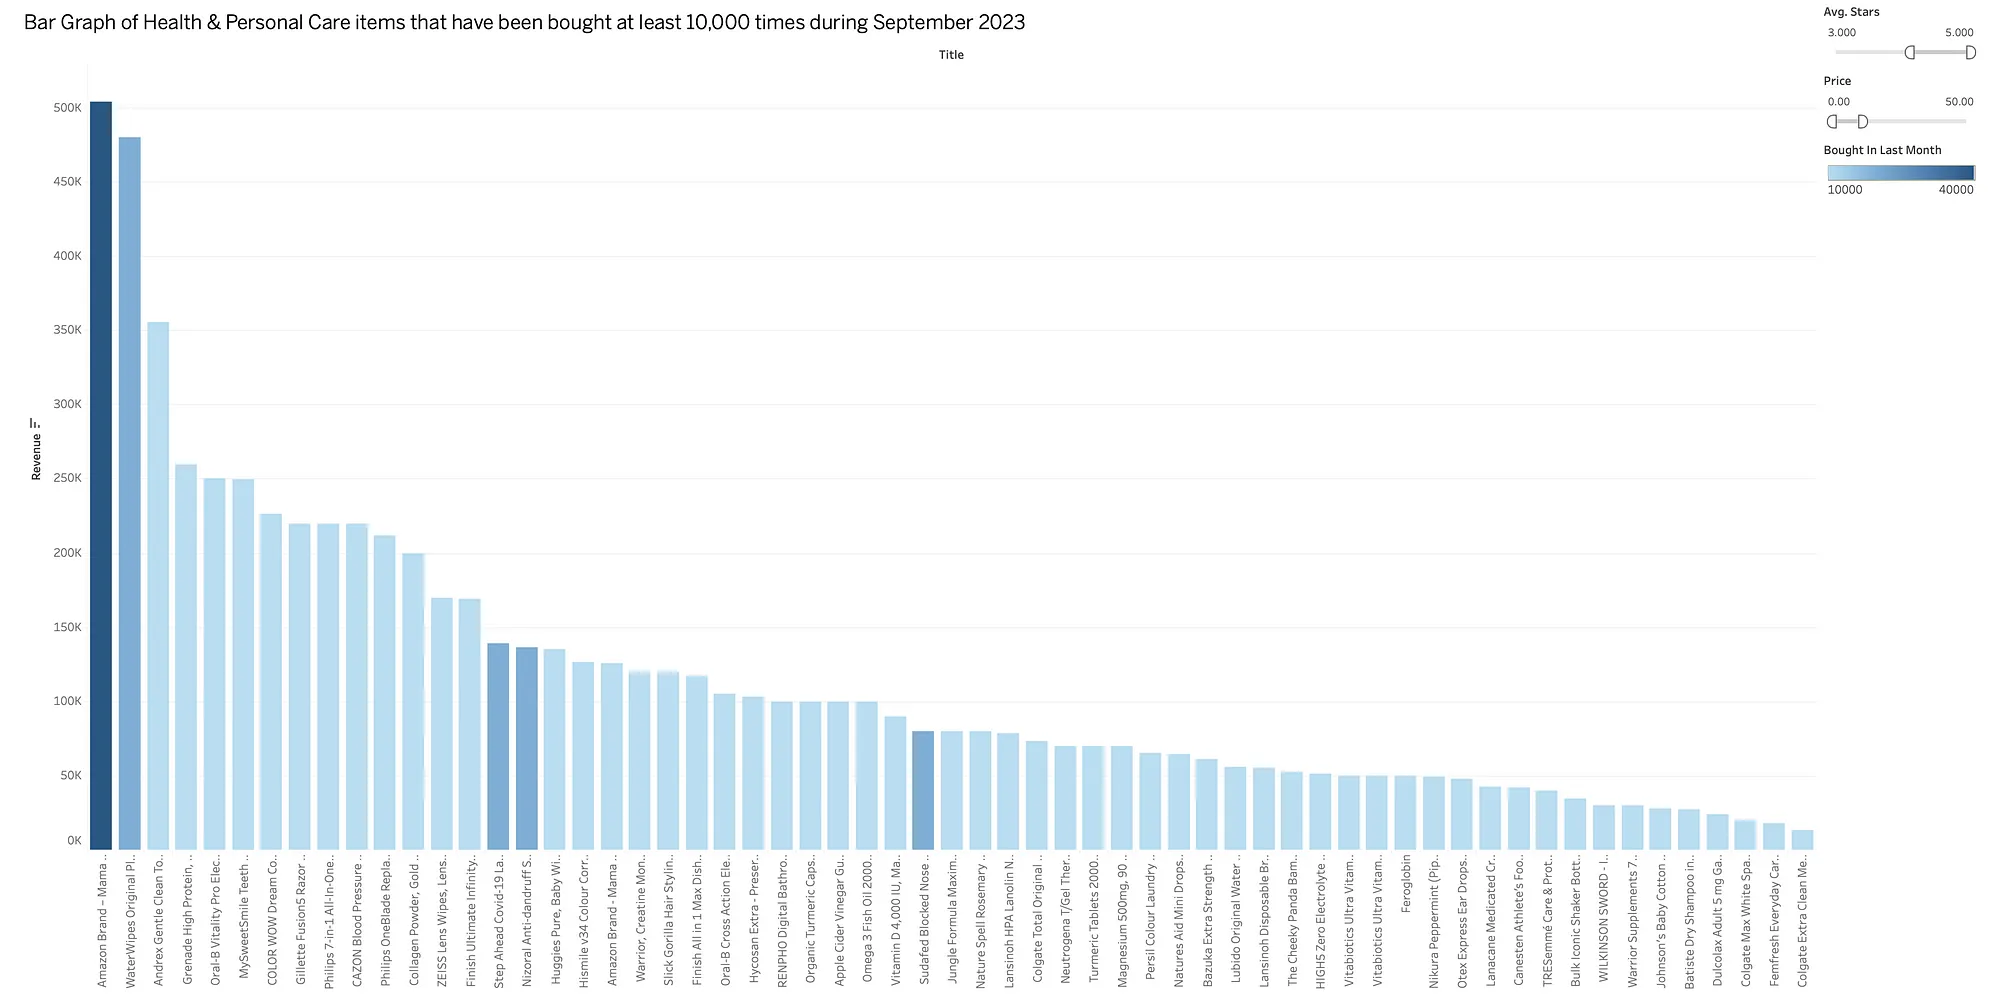
On the right of the bar graph, you’ll see interactive filters for average star ratings and price, while the legend below it illustrates the purchase frequency, ranging from 10,000 to 40,000 items sold in a single month. In this interactive dashboard(linked above), you can hover over each bar to access detailed information, including the product’s name, revenue, and purchase frequency. The title label(referring to product name) for the x-axis is towards the top of the bar graph.
Data Visualization Insights and Results
Tree Map:
In September 2023, Amazon merchants and sellers earned £99 million from the Health & Personal Care category, which made up 16.49% of its total £600 million revenue.
Scatterplot 1 (Price vs. Rating):
Most Health & Personal Care products are under £50 with an average 4-star rating, showing they’re affordable.
Scatterplot 2 (0–50 GBP):
98.4% of products in this category are priced below £50, highlighting a focus on budget friendly items.
Text Table:
Out of 8,084 products, the top 61 products earned over £7 million in one month, showing a small group drives most of the revenue.
Bar Graph:
The top 61 products were visualized in a descending bar graph to easily compare revenue across bestsellers.
©2025