Data Visualization / Data Analysis / ArcGIS
Navigating Floods: Mapping Resilience Efforts and Community Concerns in Brooklyn
This project explores the challenges of recent flooding in Brooklyn, New York, and the city's green infrastructure initiatives designed to mitigate stormwater runoff. Using various GIS tools, I mapped community reported flood concerns (311 calls) and overlayed flood hazard projections, all while analyzing how green infrastructure can help reduce future flooding risks.
Research Goals
Visualize 311 flooding complaints alongside NYC stormwater flood risk projections
Identify flood prone zones and assess how green infrastructure mitigates risk
Use elevation data to analyze terrain's role in water accumulation
Translate technical geospatial data into accessible, story driven visualizations for a larger audience
Datasets Used
311 Flooding-Related Complaints – Community data on flooding issues reported to NYC’s 311 system
NYC Stormwater Flood Map – NYC.gov
Green Infrastructure System – NYC Green Infrastructure
DEM LiDAR Data – Elevation data for understanding terrain and flood risk
Flood Hazard Analysis – Projections for flood risk with future sea level rise
Methodology
Community Flooding Complaints
Mapped 311 complaints related to flooding, highlighting areas with recurring concerns
Focused on sewer, drainage, and stormwater system issues
Overlaying Flood Hazard Projections
Applied NYC Stormwater Flood Map to visualize flood-prone zones with 2050 sea level rise predictions
Used color coding to show moderate and severe flood risks
Green Infrastructure Mapping
Mapped green infrastructure installations across Brooklyn using LiDAR DEM data to assess flood mitigation effectiveness
LiDAR DEM Integration
Used Digital Elevation Model (DEM) to understand terrain elevation and its impact on flood risk
Integrated LiDAR data to create a more detailed view of Brooklyn’s landscape, with varying flood risks based on terrain
Tools Used within ArcGIS:
geoprocessing tools and techniques
Attribute Query / Filtering
Spatial Join
Layer Symbology
Overlay Analysis
Clipping
Select by Location / Attribute
Map Styling / Layout
Raster Visualization (DEM styling)
Raster Reclassification / Stretching
Point Layer Mapping
Symbolization and Layer Ordering
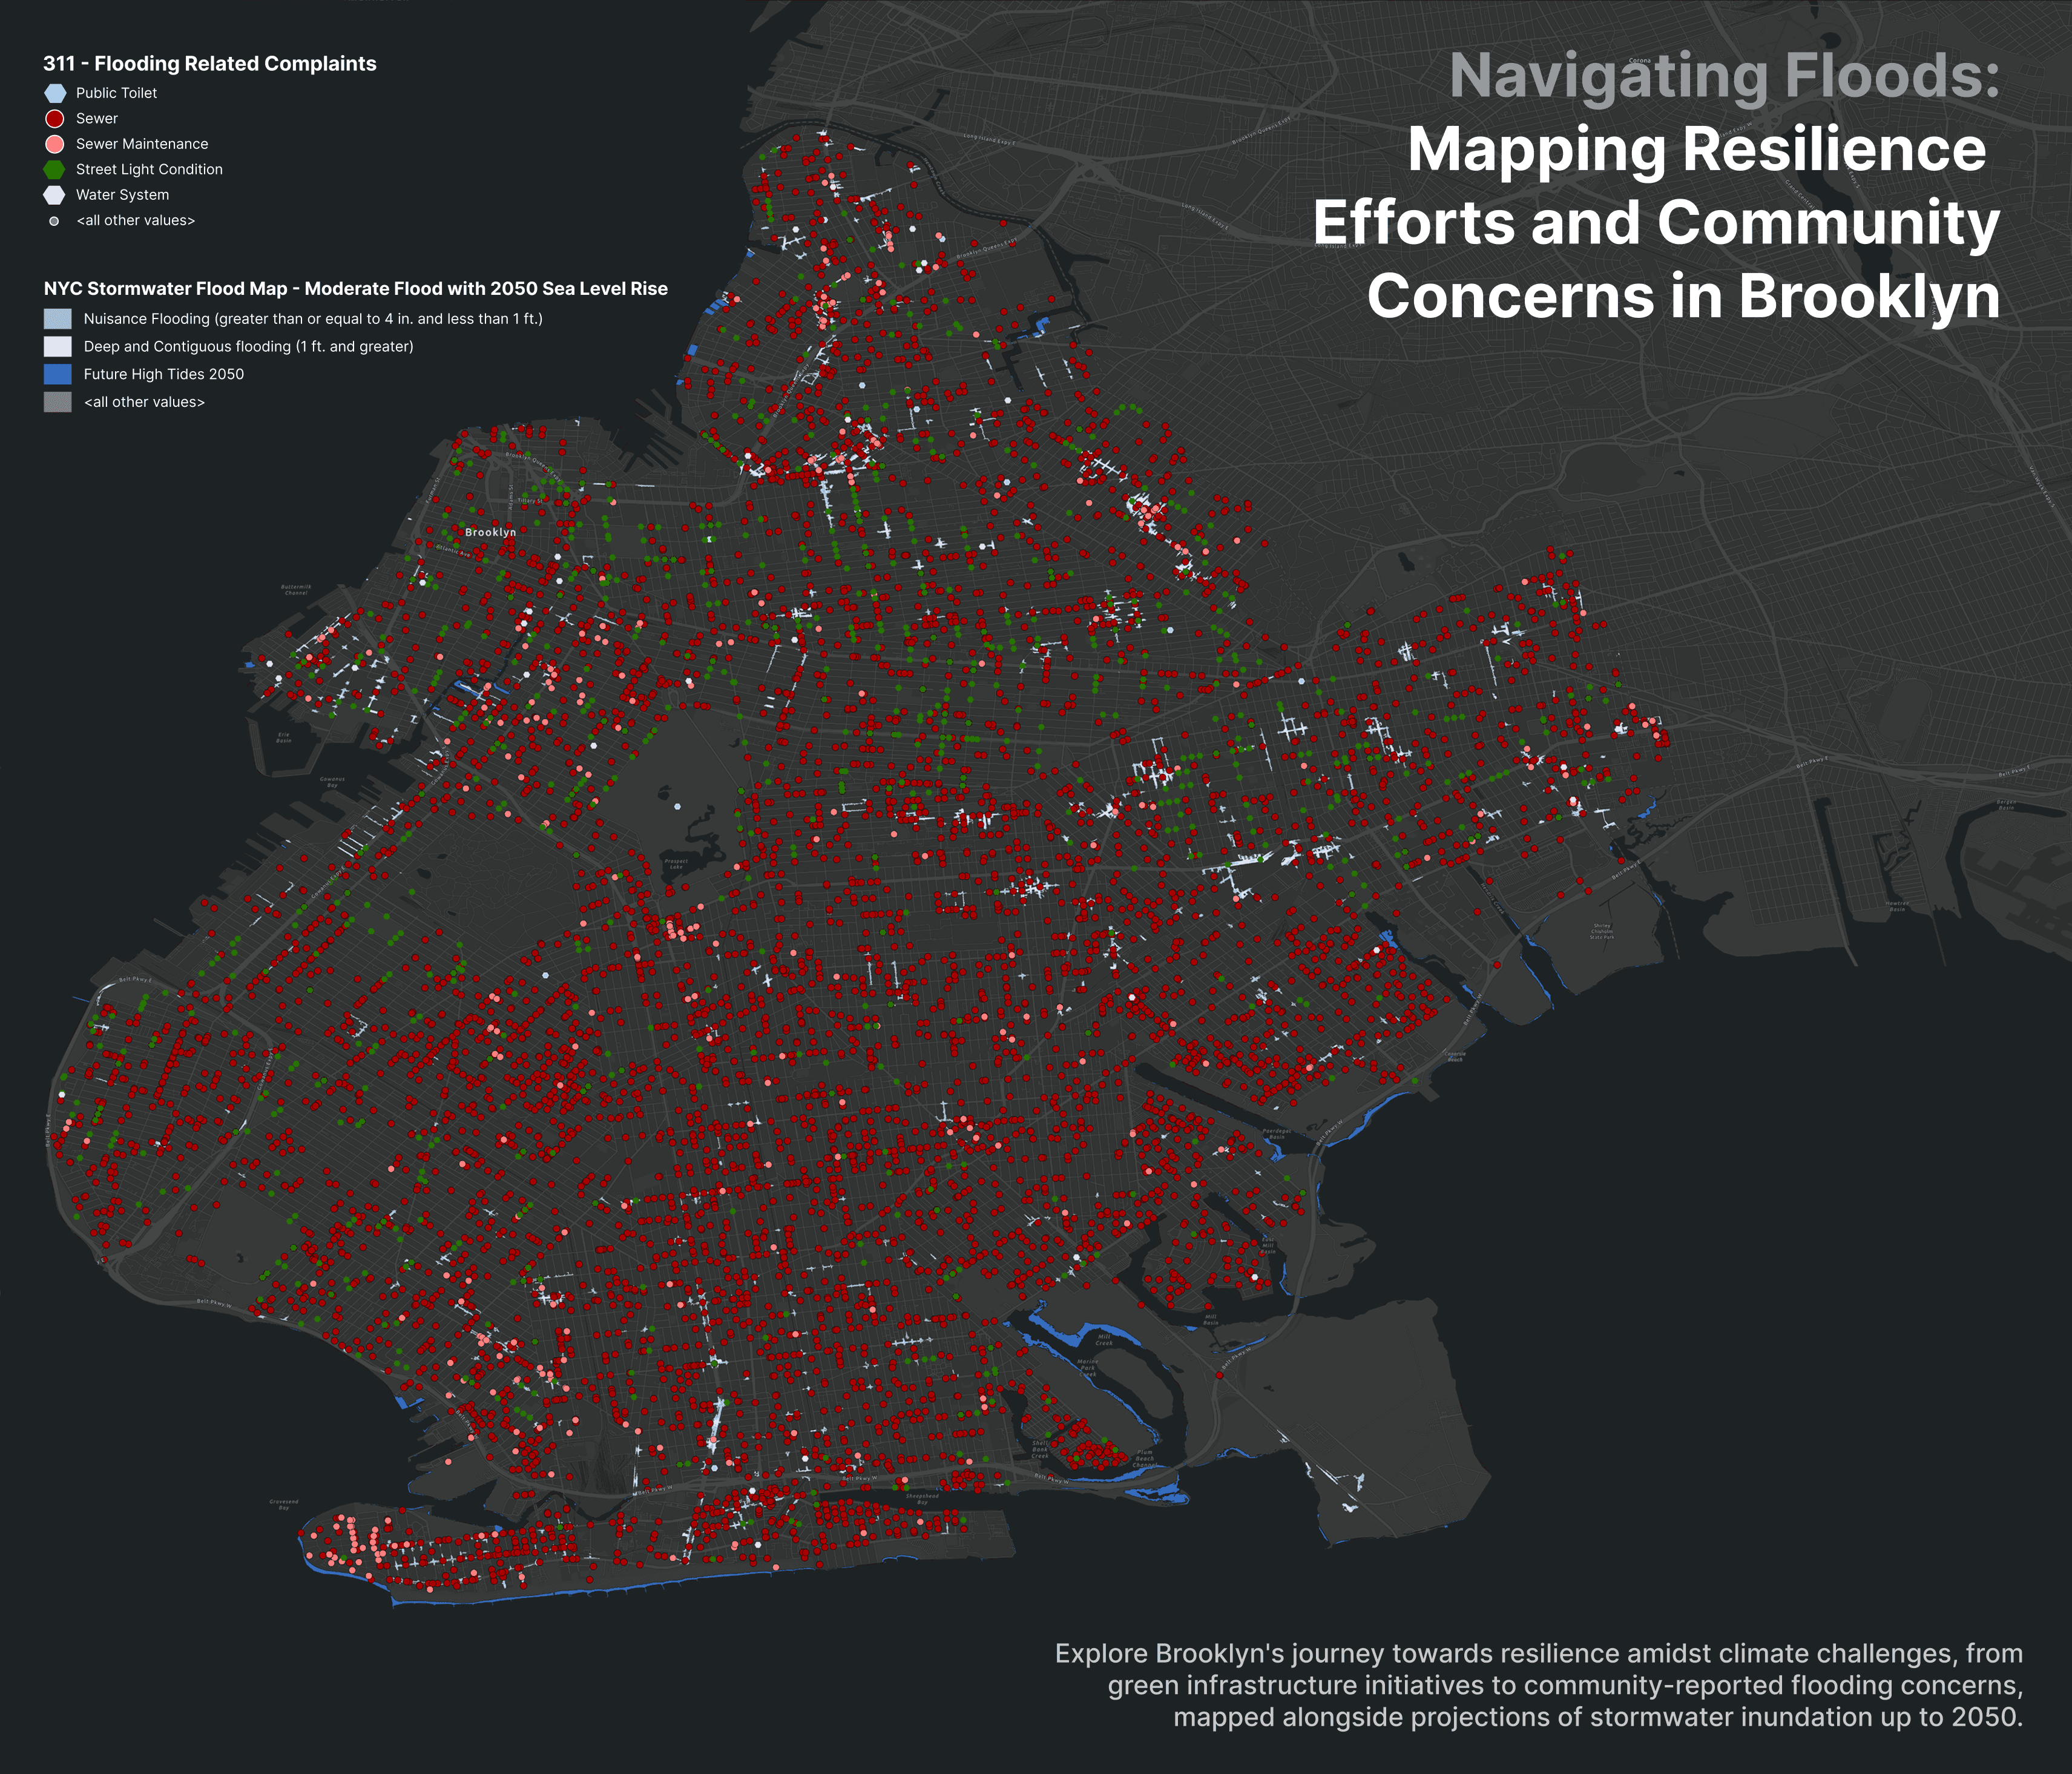
Navigating Floods Map
For my first map, I visualized 311 flooding-related complaints in Brooklyn using color-coded dots to categorize issues like sewer maintenance, street conditions, and water system problems. I layered this with NYC’s stormwater flood projections for 2050, including frequent flood zones, deep flooding areas, and FEMA’s future high tide lines.
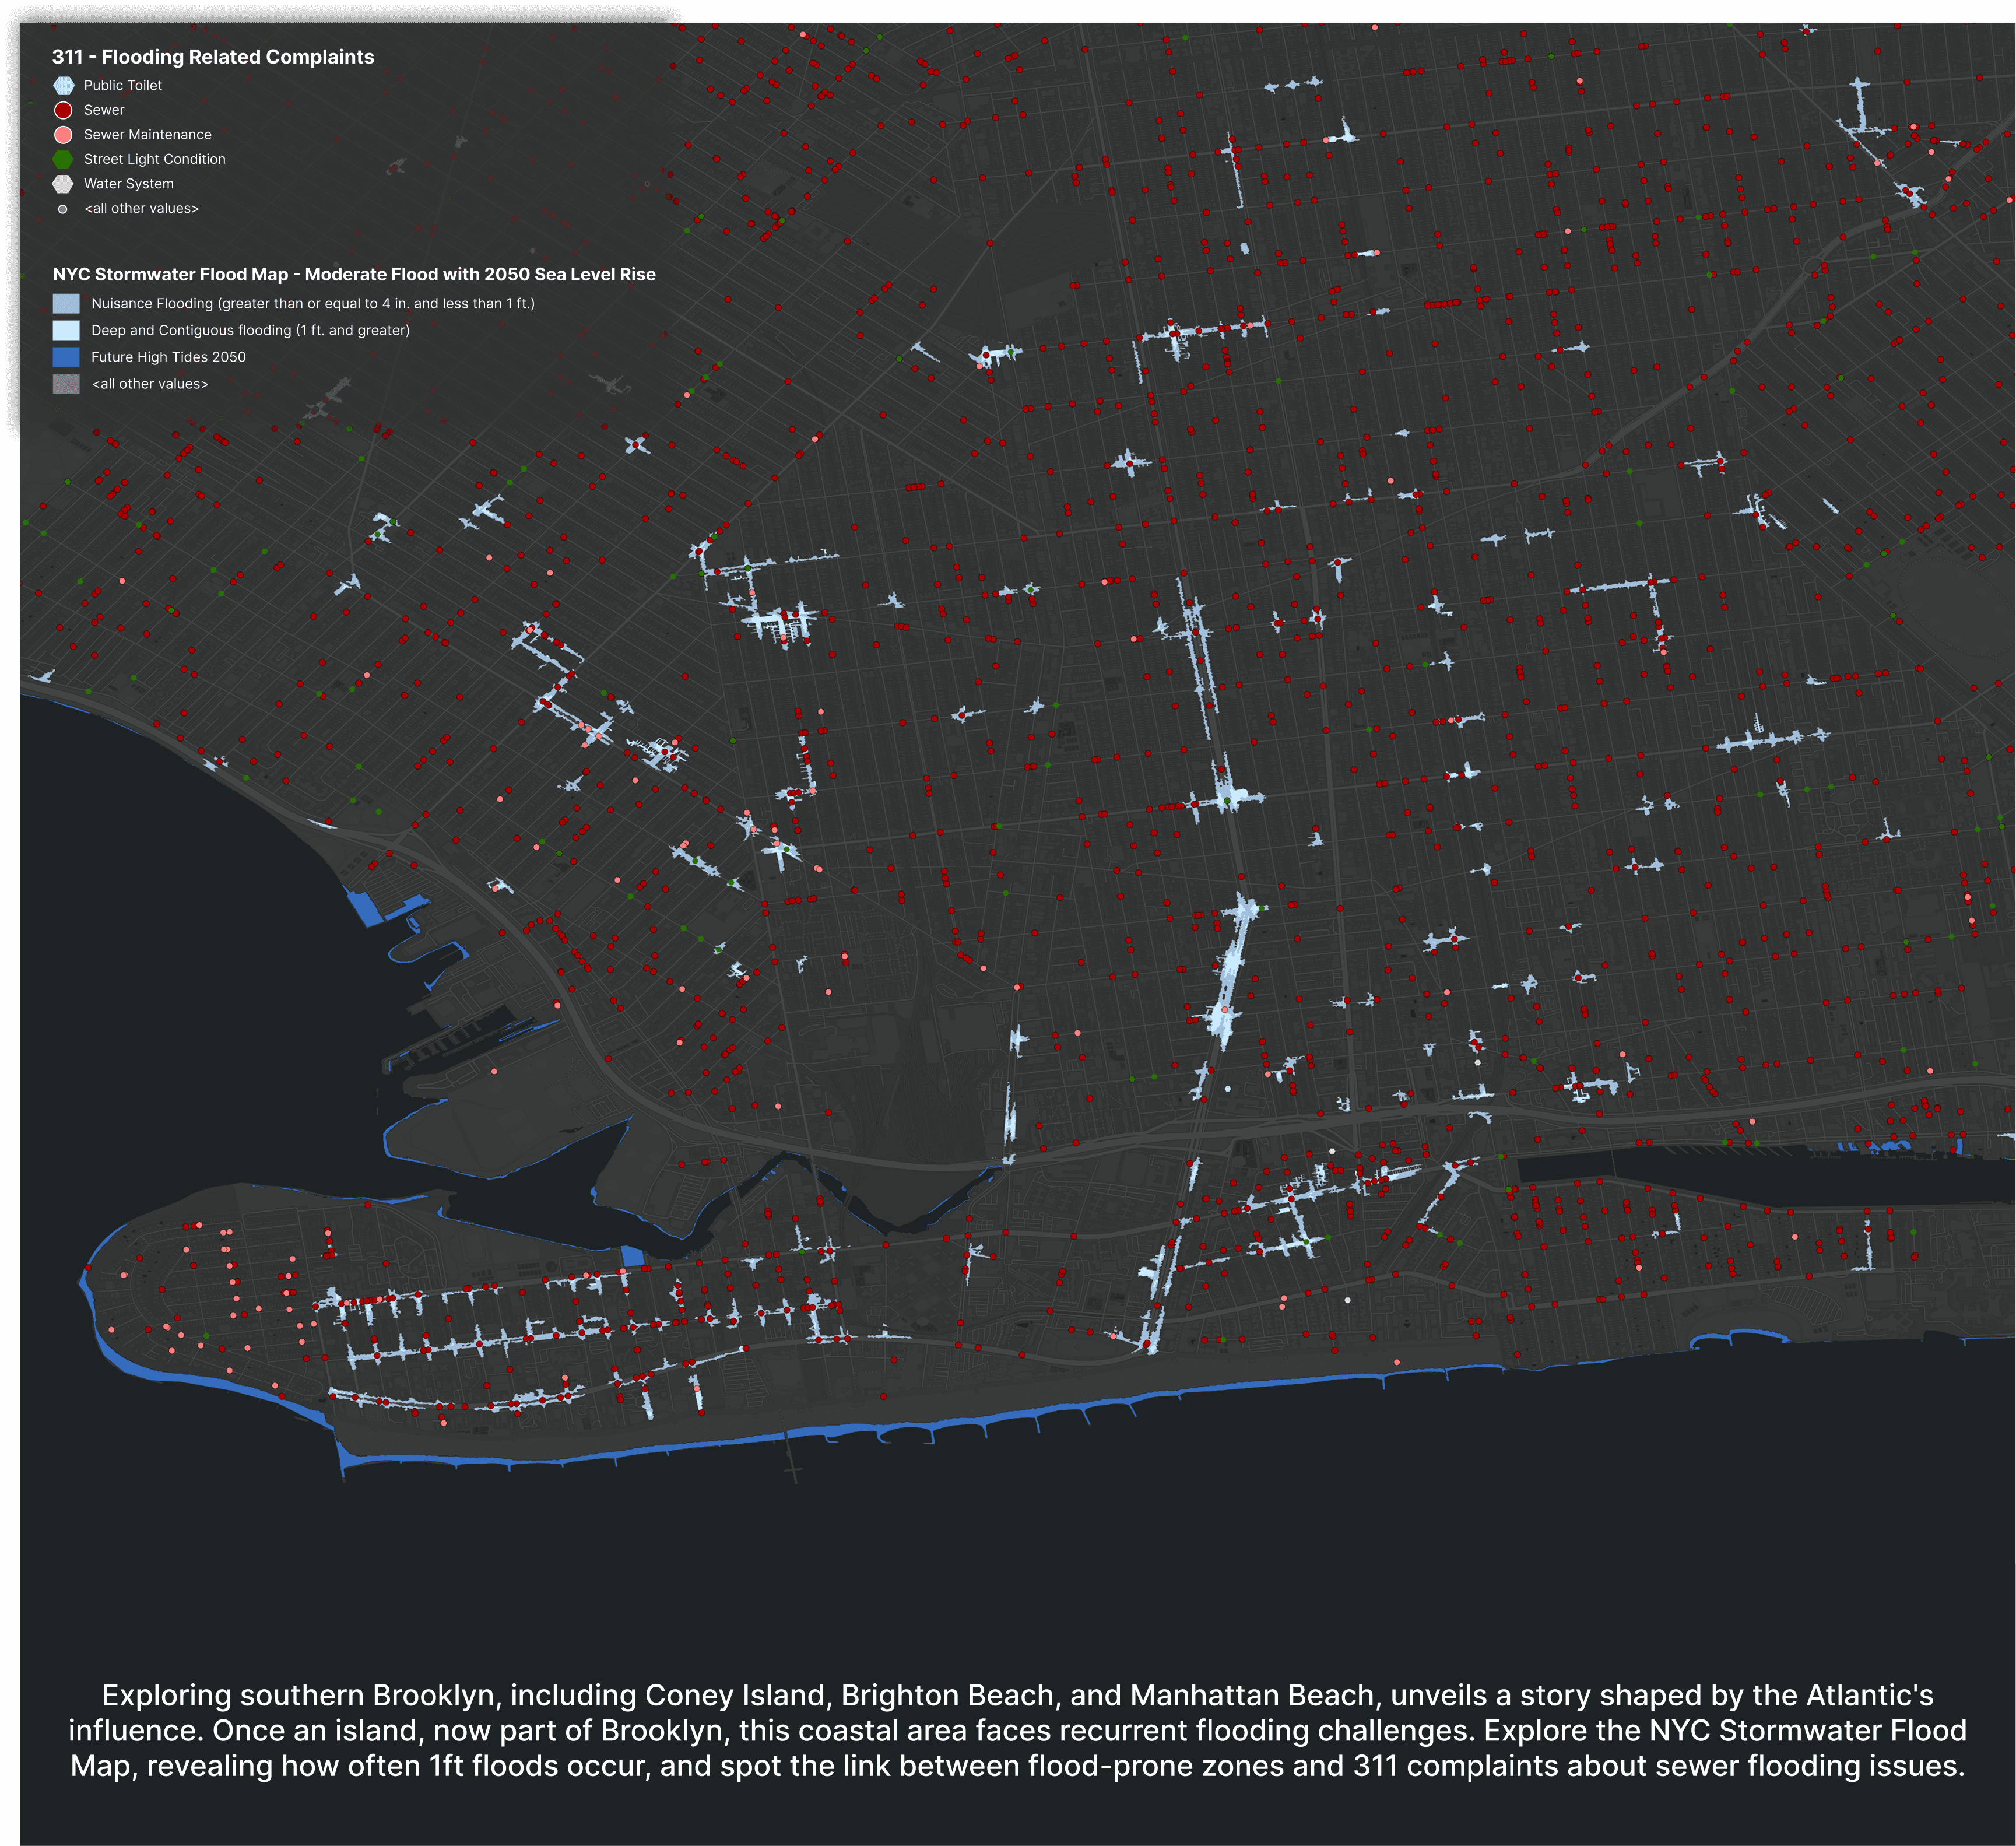
A closer look into Southern Brooklyn
For my second map, I zoomed in on southern Brooklyn to focus on neighborhoods like Coney Island and Brighton Beach. I kept the same layers from the first map, showing 311 flood complaints and the 2050 flood projections, but wanted to look at them more closely to understand how flooding shows up at the street level.
Zooming in made it easier to see how complaint hotspots line up with areas expected to flood in the future. A lot of the complaints came from places that are also projected to experience deep flooding, especially along the southern coast.
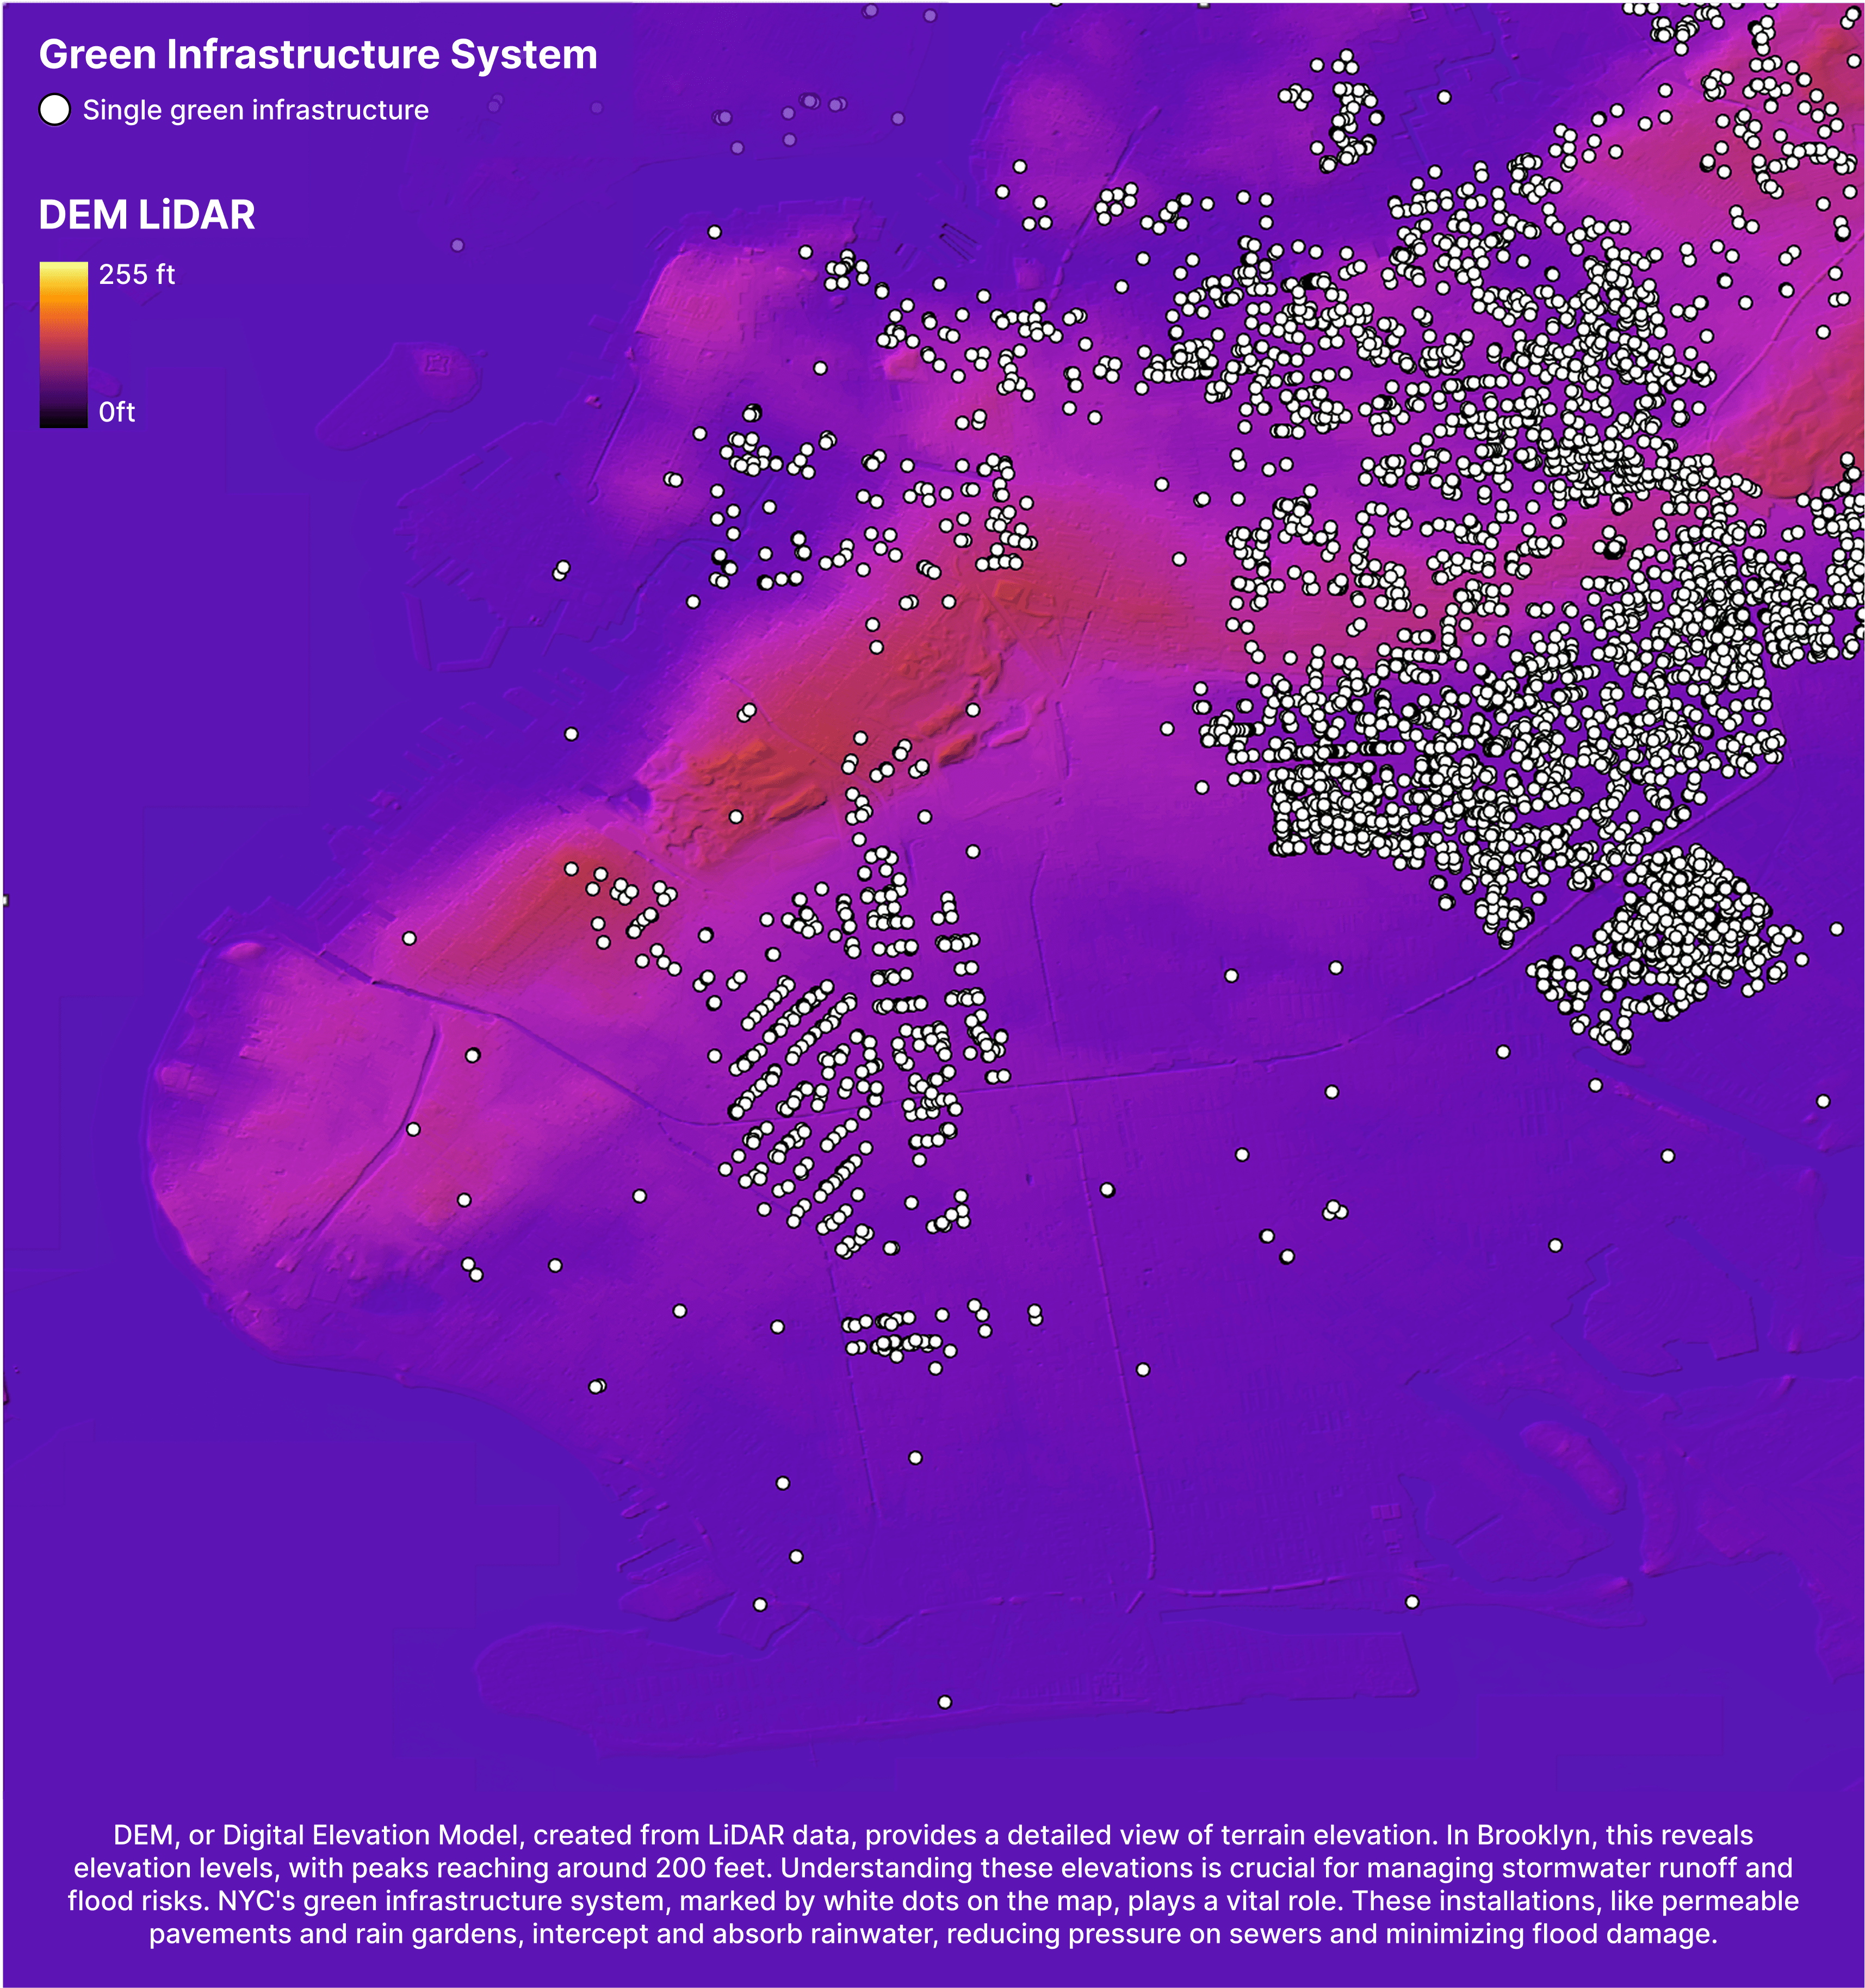
Digital Elevation Model (DEM) with LiDAR
For this map, I worked with a Digital Elevation Model (DEM) using LiDAR data to show elevation across Brooklyn. I used a color gradient to highlight low-lying areas and then overlaid green infrastructure locations as white dots to see where stormwater systems are currently in place.
I wanted to understand how elevation plays a role in flood risk and whether green infrastructure is being installed where it's needed most. What I noticed was that many of the lowest areas, especially in southern Brooklyn, didn’t have much green infrastructure coverage. Most of the installations seemed concentrated in other parts of the borough that are on higher ground.
©2025