Data Analysis / Data Visualization / Product Design
NFL EDA Stats with R
Building a Coach-First Dashboard with NFL Player Tracking Data
Overview Description
Participating in the NFL Big Data Bowl 2024 provided a unique opportunity to explore the intricacies of football through the lens of data analytics. Hosted by the National Football League (NFL), this competition called for analyzing player tracking data from Weeks 1-9 of the 2022 NFL season, explicitly focusing on deriving practical insights related to tackling.
The central challenge centered around understanding the dynamics of tackling: those crucial moments in a football game when defenders aim to stop the ball carrier. My goal was straightforward; to develop metrics that could reveal valuable information, such as predicting the timing and location of tackles, evaluating player performance, and/or understanding team strategies.
Equipped with thirteen datasets, including player location, speed, player data, and more, I decided to use those for the Coach track for my submissions. The evaluation criteria for that track emphasized the practicality, correctness, and clarity of reports and data visualizations.
Problem Objective
For this project, my focus is on understanding how I can find insights that will be helpful to the coaches of the NFL. I'm looking into the player tracking data from Next Gen Stats to create stats and visualizations that the coaches can use. I want to go beyond the usual data and provide real-time insights that make sense in the actual game. By looking closely at tackling tactics and strategy, I aim to create practical insights and a data visualization dashboard that coaches can use to improve their defensive strategies.
Research Question
The central research question that guides this project is formulated to address the unexplored territories within the realm of player tracking data:
Research Question: How can data analytic techniques extract novel and actionable statistics from Next Gen Stats player tracking data in the NFL, particularly in unexplored areas?
Motivation
I chose a Kaggle completion for my final project because I wanted to engage in a real-world challenge, utilizing my data analytics skills to solve problems and find meaningful insights. I have always wanted to use my skills and interests in data and visualization to create something that can be used consistently to solve a problem in real-time.
Working with a sports dataset, especially one centered around a game as complex as football, posed a significant challenge. Given my limited knowledge of the sport, understanding its intricacies and deciphering how the data could be practically applied would be challenging.
I began a thorough background and literature review to read and learn as much as possible about the NFL, American football in general, and how coaches impact players and games.
Tools Used
Tableau, R, Kaggle, Figma
Background Research
The National Football League (NFL) is the American football league in the United States. Established in 1920, the NFL has evolved into a cultural phenomenon, captivating audiences with its athleticism, strategy, and competition blend. The league comprises 32 teams, evenly divided into two conferences: the National Football Conference (NFC) and the American Football Conference (AFC).
Teams and Structure:
Each conference is further subdivided into four divisions, resulting in eight divisions in total. Teams compete in a regular season, fighting for a spot in the playoffs and, ultimately, the Super Bowl (The NFL championship game). The 32 teams represent diverse cities across the United States, each with its unique history, fanbase, and culture.
Game Structure:
An NFL game consists of four quarters, each lasting 15 minutes (with breaks and pauses). The primary objective is for a team to score points by advancing the football into the opposing team's end zone or kicking it through the opponent's goalposts. Standard scoring methods include touchdowns (6 points), field goals (3 points), and extra points or two-point conversions after touchdowns.
Coaching Dynamics:
NFL teams are led by head coaches, who oversee the overall strategy and game planning. Coaches work with coordinators specialized in offense, defense, and special teams. The staff includes position coaches responsible for specific player groups, fostering skill development and strategic execution. Up to 15 coaches may be present on the sidelines in a single game, providing real-time guidance to players. Coaches analyze opponent strategies, make in-game adjustments, and ensure players execute the devised game plan effectively.
Player Positions:
NFL teams consist of three central units: offense, defense, and special teams. Players are specialized based on their positions, each with distinct roles and responsibilities.
Some of the most popular positions are the quarterback (QB), Running back (RB), Wide receiver (WR), Tight end (TE), and Linebacker (LB). Depending on the position, they will pass the ball and make critical decisions, catch passes, and block opponent passes. The defensive positions disrupt plays against the opponents, defend against runs, and act as cornerbacks.
Strategy:
Understanding the dynamics of these positions is essential for practical game analysis and strategy development. Each position's unique skills and responsibilities contribute to the overall team strategy and performance. I aimed to do at least two different kinds of analyses for each dataset to see what kind of insights I could gather.
Coaches & Strategy:
Coaches play a pivotal role in NFL teams, devising game plans, analyzing opponents, and guiding players during games. They collaborate with players and fellow coaches to develop effective strategies tailored to their team's strengths and weaknesses. Coaches use statistical analysis and real-time observations to make informed decisions during games. Each team might have up to 15 coaches, each one responsible for different people and positions.
The head coach is the leader of the coaching staff and is responsible for the entire team. They usually make strategic decisions, manage the coaching staff, and impact team culture. All the other coaches focus on their niche: the offensive coordinator, defensive coordinator, special teams coordinator, quarterback coach, wide receiver coach, running back coach, defensive line coach, and strength and conditioning coach.
To my surprise, there are almost half as many coaches as active players on a team. Focusing on the coaches and how they interpret the plays and data made sense because they had such a significant impact on how the team and players would perform. On a macro level, the coaches were the ones who were overseeing the games and players from both teams and almost acting as directors. Since there were so many coaches available, many of them could focus on 2-3 players and give them the best advice possible. This kind of intimate mentoring allows each player to receive crucial feedback to play better, both before and during a game.
Methodology
I started this exploration by deciding to participate in the NFL Big Data Bowl 2024 competition, which I came across during a review of active challenges on Kaggle. Combining data analytics with football strategy intrigued me, sparking my interest in uncovering exciting possibilities. Joining the competition was a natural step, as I was confident in applying the knowledge gained from my coursework in data analysis, transitioning from theory to practical application.
I worked with the NFL Big Data Bowl 2024 dataset, sourced from Kaggle and provided by Lopez et al. (2023). This dataset included Next Gen Stats player tracking data covering Weeks 1-9 of the 2023 NFL season, consisting of 13 datasets. Nine of these datasets focused on player tracking data collected over nine consecutive weeks, while the others delved into games, players, plays, and tackles.
The cleaning process was crucial given the dynamic nature of player tracking data. It involved handling missing values and outliers and ensuring overall data consistency. The transformation phase went beyond cleaning, encompassing data aggregation to extract insights into specific plays and players. Acknowledging the need to deepen my understanding of the NFL, I delved into comprehending the variables and their potential connections. I took some of the datasets in excel to update the datasets by adding variables when needing to cross reference or combine things like players and their teams, or things like BMI from their weight and height variables.
In terms of the sample, the dataset comprises explicitly games played in Weeks 1-9 of the 2023 NFL season, defining the population as all NFL games during this time frame. This deliberate focus ensures a nuanced exploration of the dynamics within a defined scope, laying the groundwork for meaningful insights that could be used by their coaches.
Results and Discussion:
I did many different kinds of analyses for each dataset.
I tried experimenting with different graphs and different kinds of descriptive analytics to figure out what insights were best displayed visually.
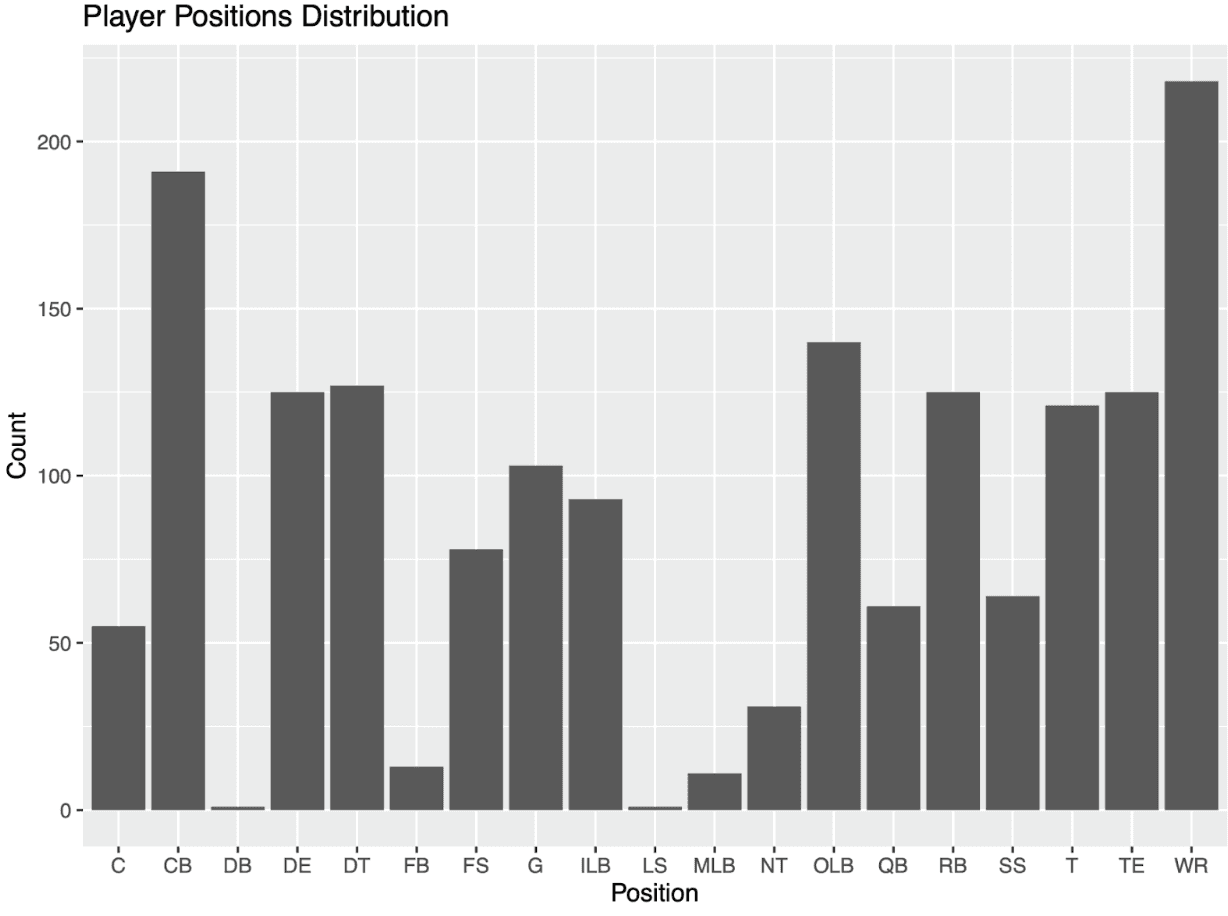
Positions & Players
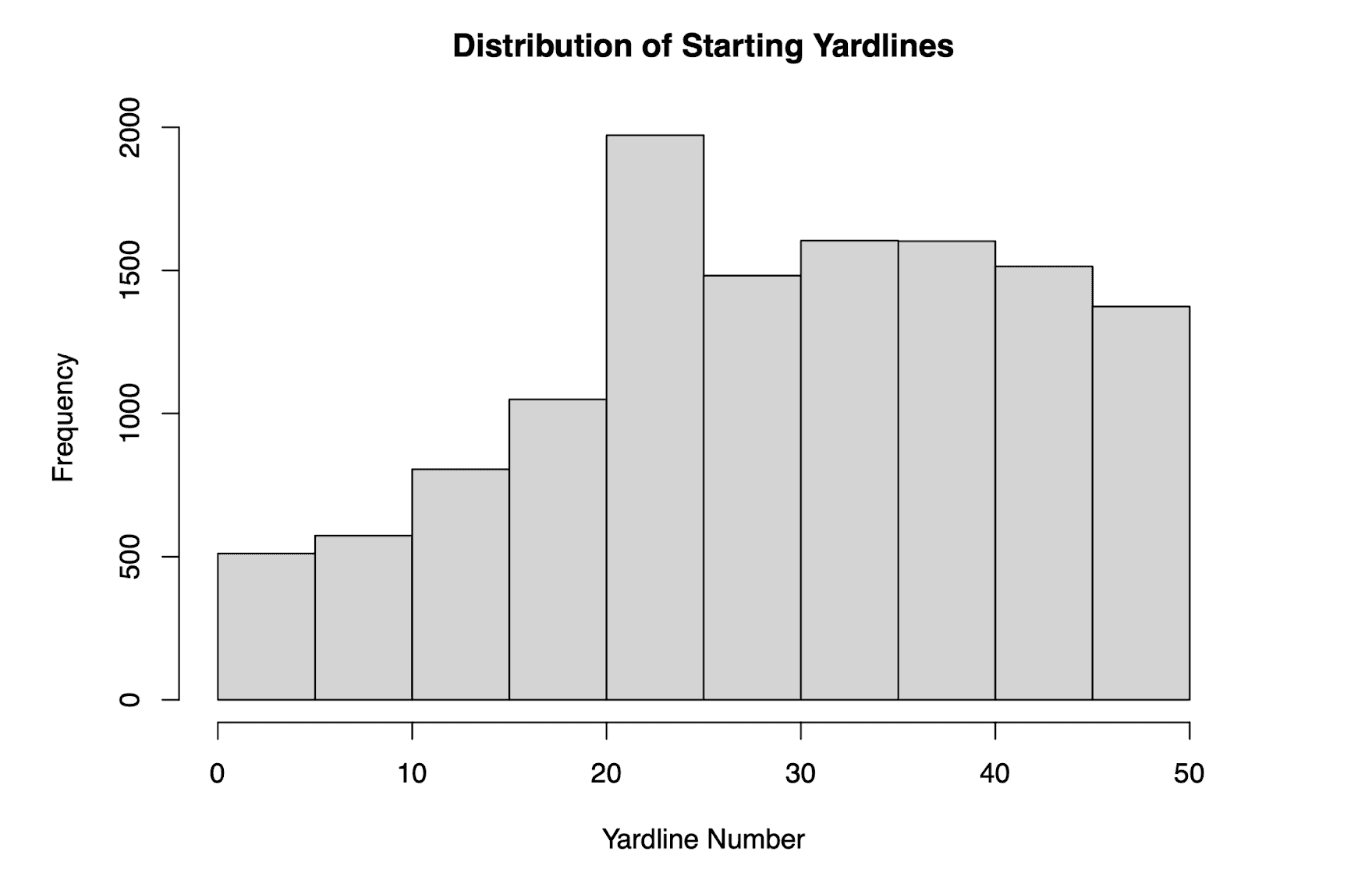
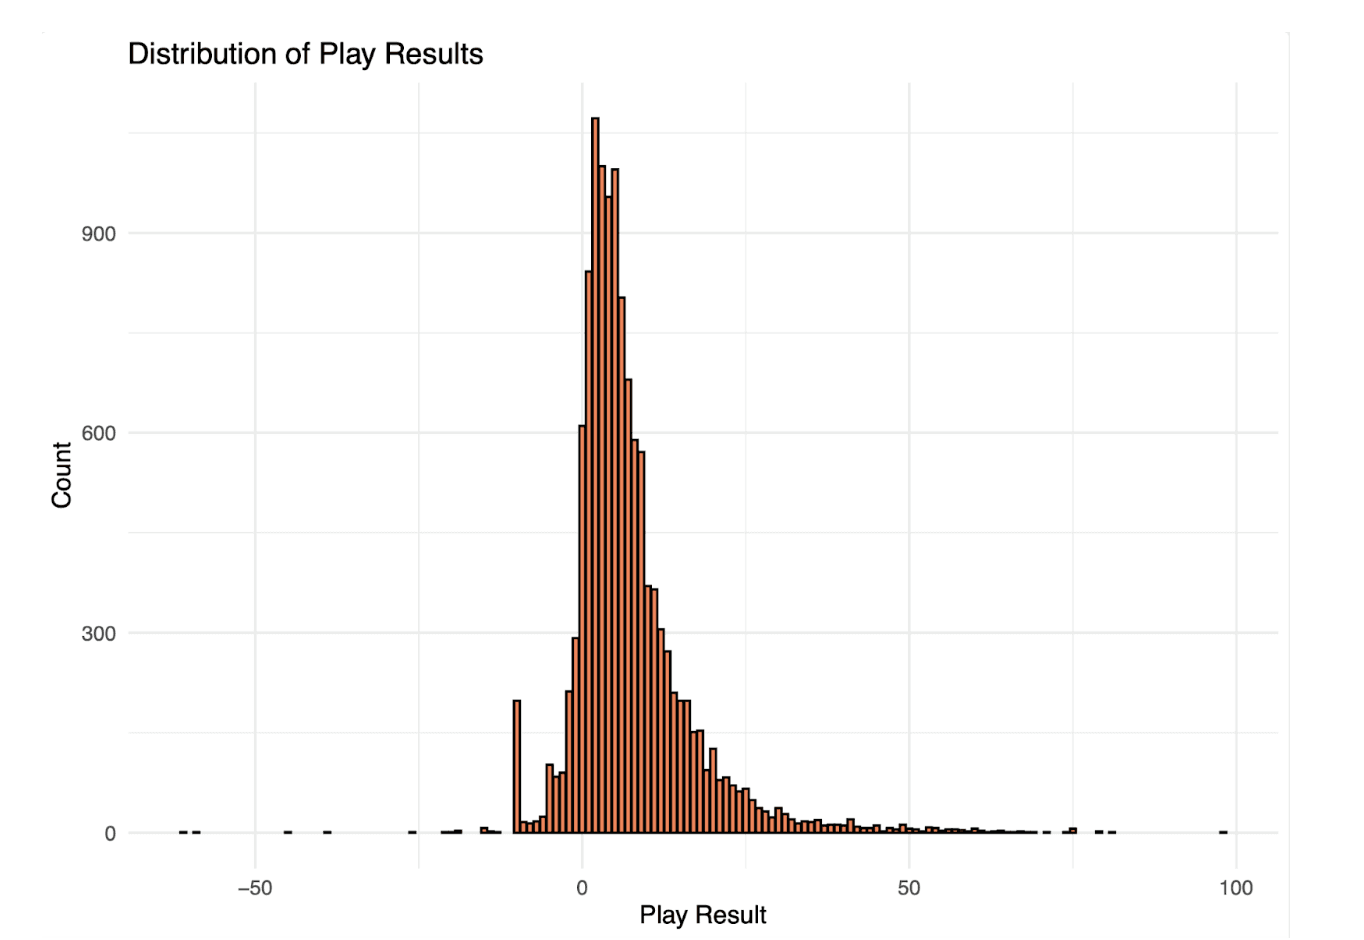
The distribution of yard lines in football plays can be a helpful metric and visualization for coaches in several ways:
Field Position Analysis: Understanding where plays typically start on the field provides coaches with insights into field positions. Teams might have different strategies based on whether they are in their territory, approaching the opponent's red zone, or in scoring position.
Game Planning: Coaches can use the distribution of starting yard lines to inform their game planning. For example, they might adjust their offensive or defensive strategies based on whether they are closer to their goal line or the opponent's.
Risk Assessment: Plays that start deep in a team's territory (e.g., near their end zone) may be riskier, as mistakes in these areas could result in turnovers or safeties. Coaches might tailor their strategies to minimize risks in such situations.
Opponent Analysis: Analyzing the distribution of starting yard lines for both the team and its opponents can reveal patterns and tendencies. Coaches can exploit or defend against these tendencies during games.
Special Teams Strategy: The distribution of starting yard lines is particularly relevant for special teams' plays (kickoffs, punts). Coaches may adjust their special teams strategies based on whether they are kicking or receiving and the likely starting field position.
In summary, while the distribution of yard lines might not be a standalone metric, it is a foundational piece of information that coaches can leverage to make informed decisions, devise strategies, and adapt their game plans. I decided I could interpret these results and find a way to add other kinds of visuals that would benefit coaches to see in real-time. Along with that, they can use those kinds of metrics to figure out which active players they want to have on the field.
The assignment of players to specific positions is a strategic decision made by the coaching staff. Coaches consider various factors when determining player positions, including the individual player's skills, physical attributes, experience, and the team's overall strategy for a particular game or situation.
Here are some critical points regarding player positions and their assignment:
Player Skills and Attributes: Coaches evaluate players based on their skills, athleticism, and football IQ. Different positions require different skill sets, such as speed, agility, strength, and game knowledge.
Versatility: Some players may be able to play multiple positions, while others may specialize in a particular role. Versatile players provide flexibility in adjusting strategies during a game.
Team Strategy: The coaching staff develops a game plan that considers their team's and opponent's strengths and weaknesses. Player assignments are aligned with the strategic goals of the team.
Opponent Analysis: Coaches analyze the strengths and weaknesses of the opposing team. Player matchups, especially in one-on-one situations, are crucial in determining the best positions for each player.
Game Situation: The coaching staff makes real-time decisions based on the game situation, including the score, time remaining, field position, and down-and-distance. This can influence which players are on the field and their positions.
Injuries and Substitutions: Injuries or the need for another player may lead to substitutions during a game. Coaches must adjust player positions based on the available personnel.
Player Development: Players may develop or refine new skills over time. Coaches may adjust player positions to maximize their contributions to the team.
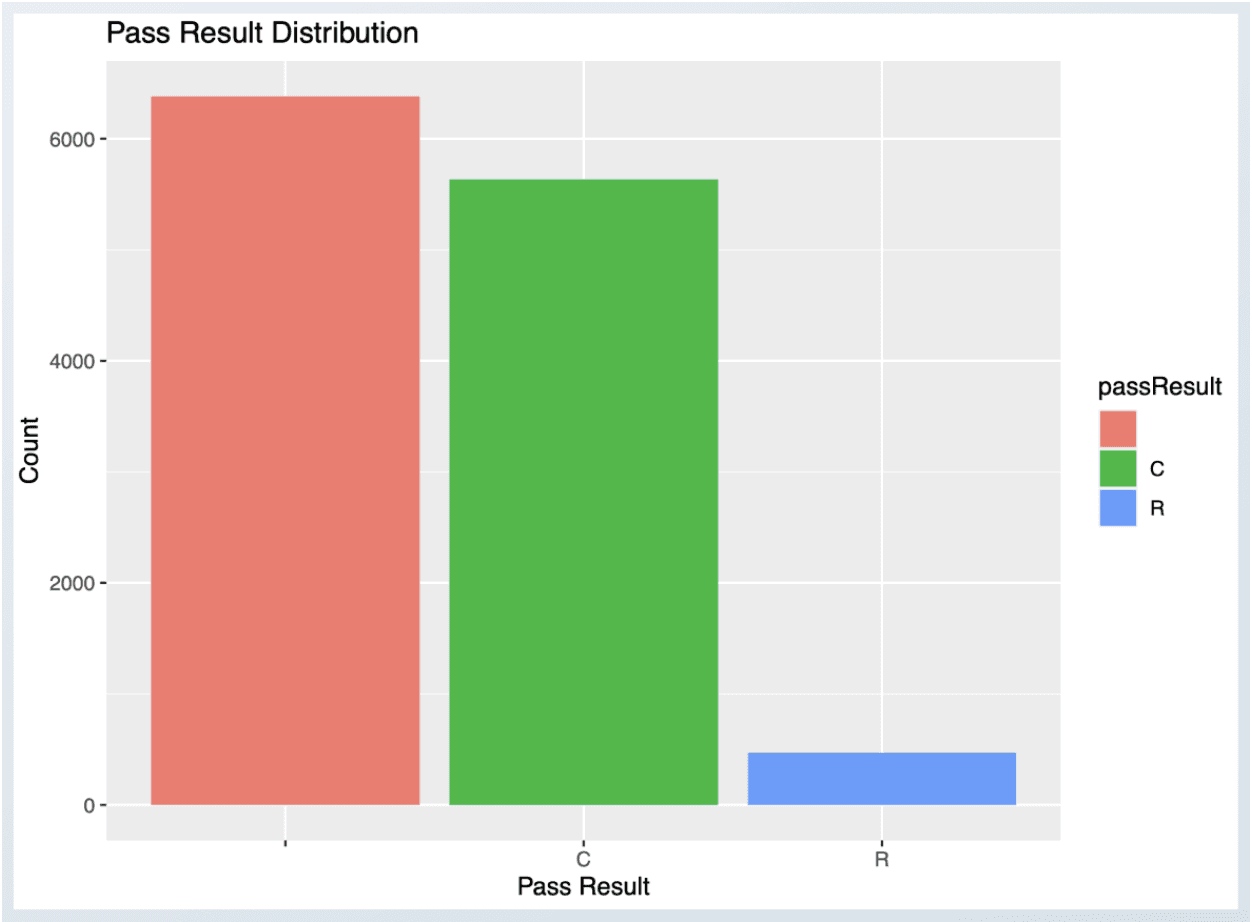
The pass and completed pass bar graph is another extremely helpful visualization that adds insights into game points, game strategy, and how well the players are doing in regards to how many balls were successfully passed vs successfully passed with no points/touchdowns.
Leveraging Strategic Insights:
The pass and completed pass bar graph is another extremely helpful visualization that adds insights into game points, game strategy, and how well the players are doing in regards to how many balls were successfully passed vs successfully passed with no points/touchdowns.
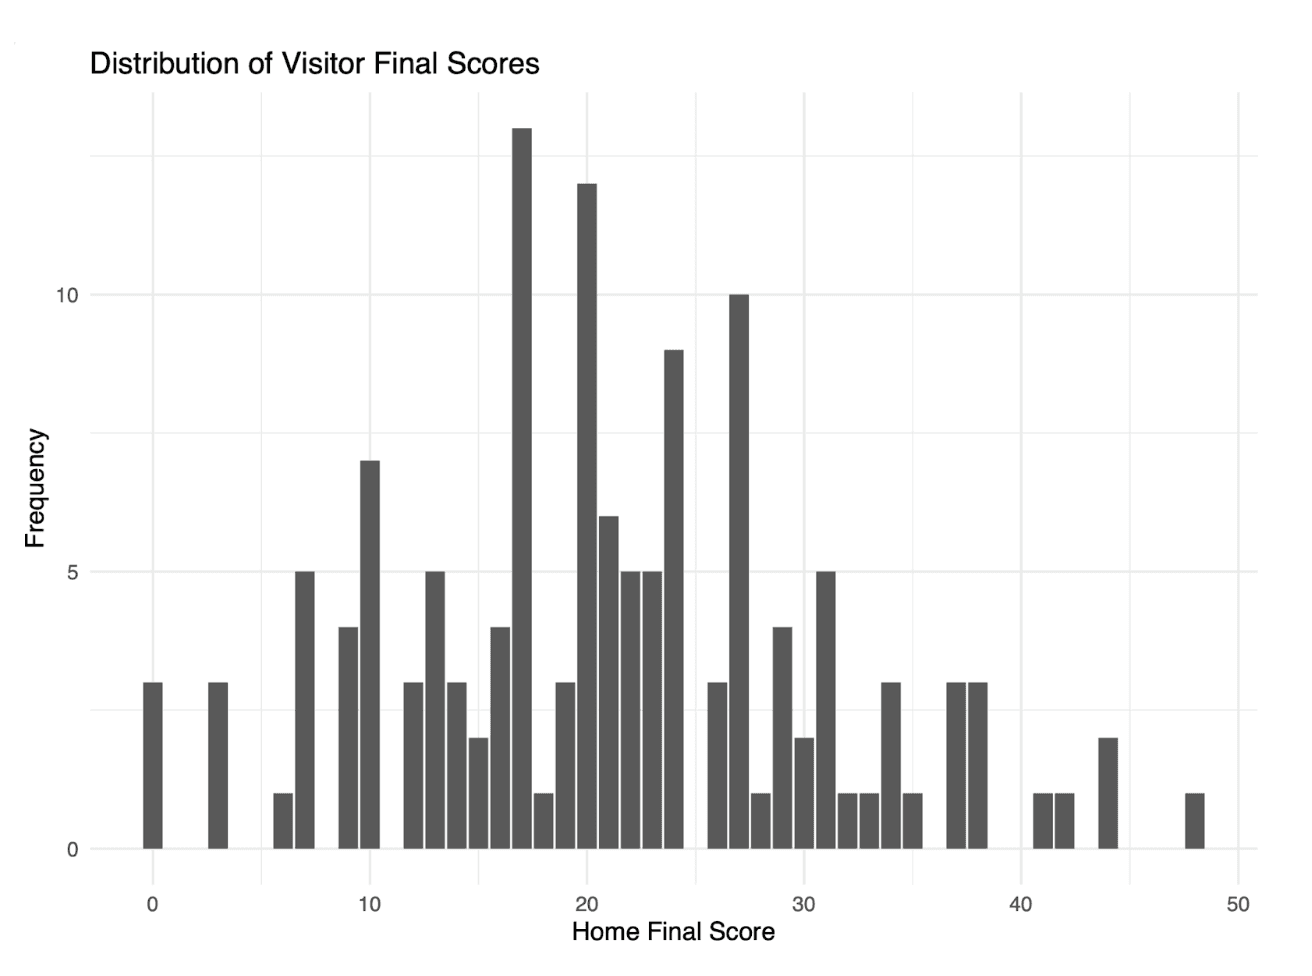
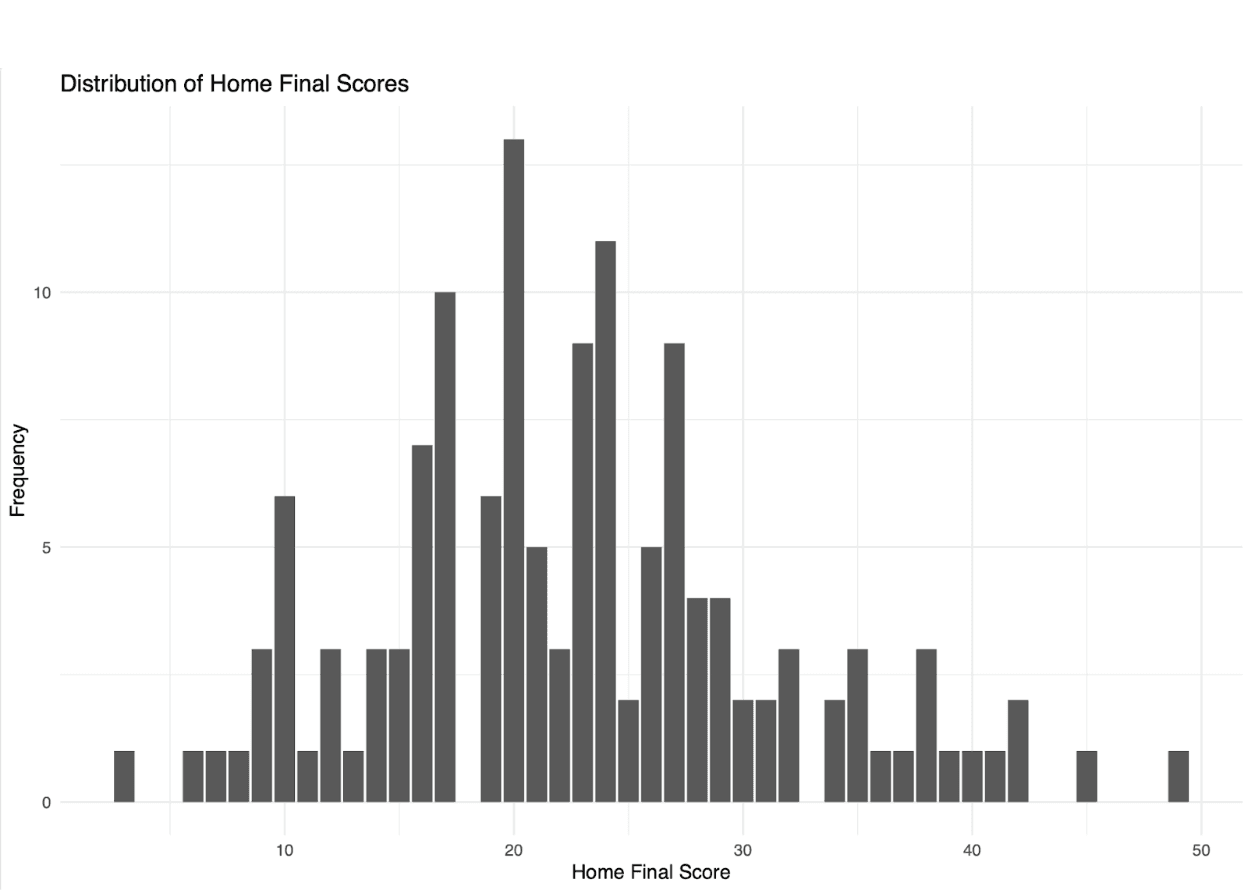
A part about winning percentages shows how teams do over time, and comparing home and away performance helps understand where they play better.
Moving to Tableau, I wanted to use dashboards to summarize the different datasets, show team trends, and explore individual games. I also realized with ggplot, all of the visualizations were static, and I needed something interactive for coaches that they could customize and toggle whenever they needed.
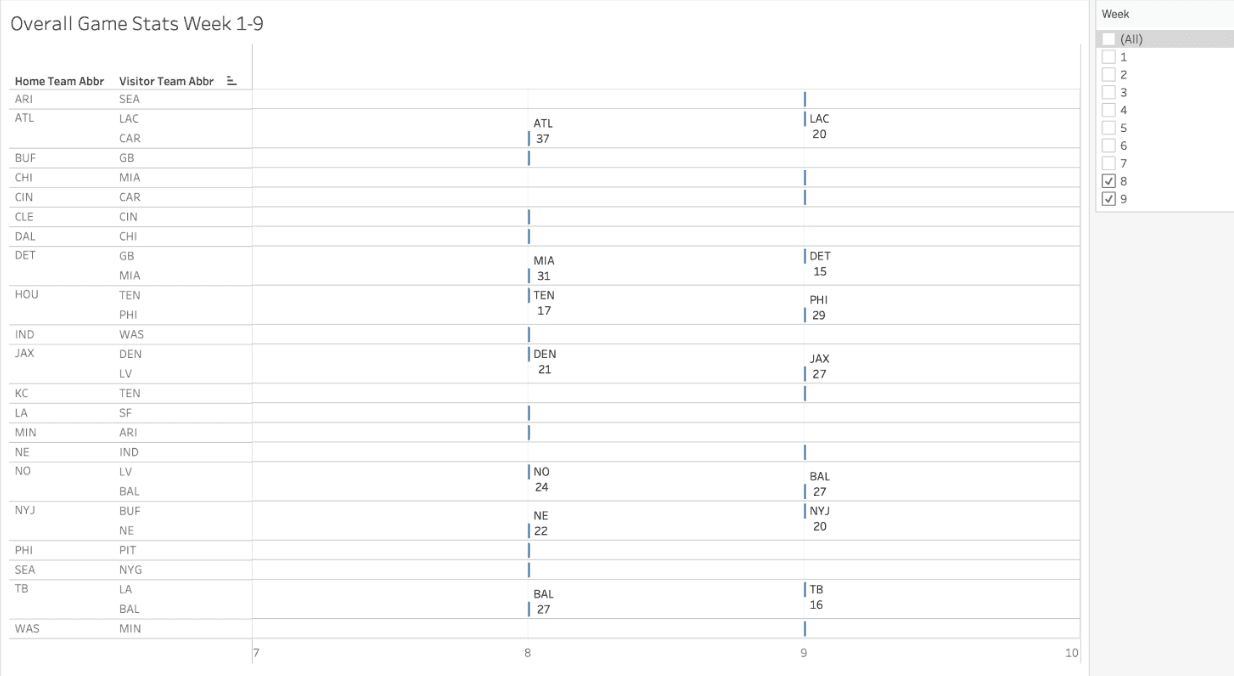
I explored essential data from the players and team datasets. For one interactive visualization, I realized I could encompass all the recent games, the teams that won, whether they were home or visitor teams, who they were against, and the number of points they received to win. I included a toggle so the coach could parse the different games to see how different teams were doing. Along with that, the coach can toggle how many games they want to see.
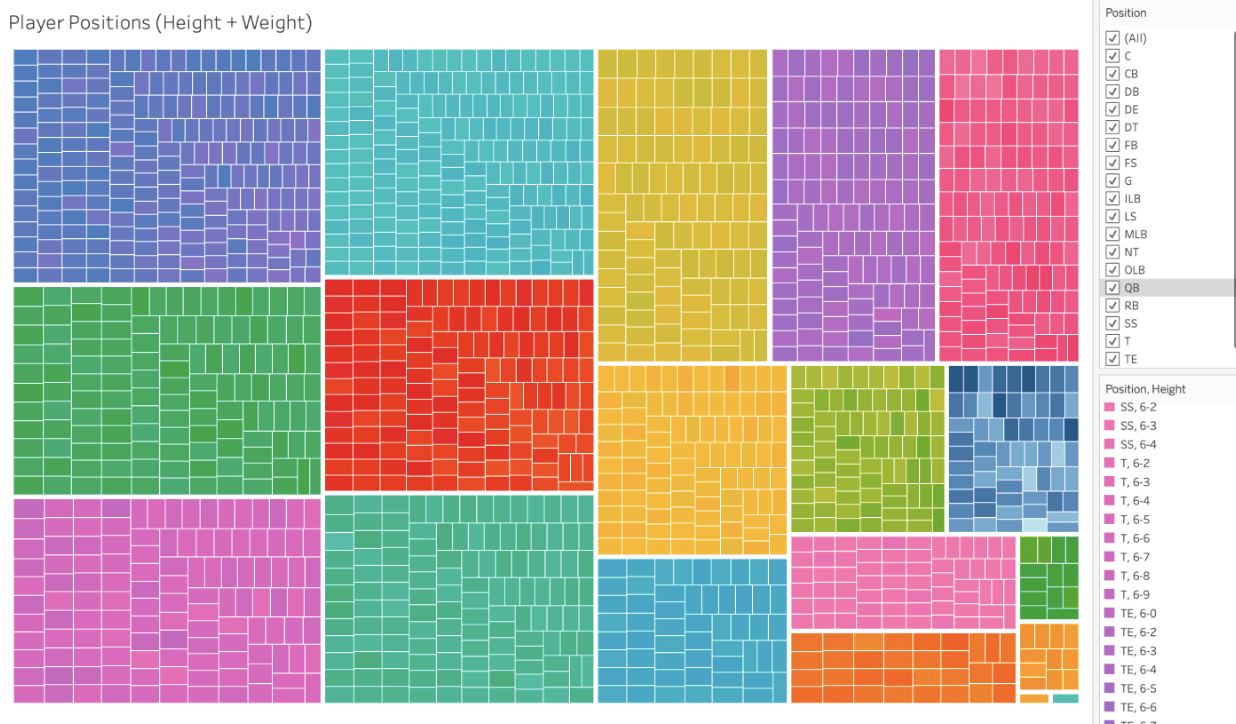
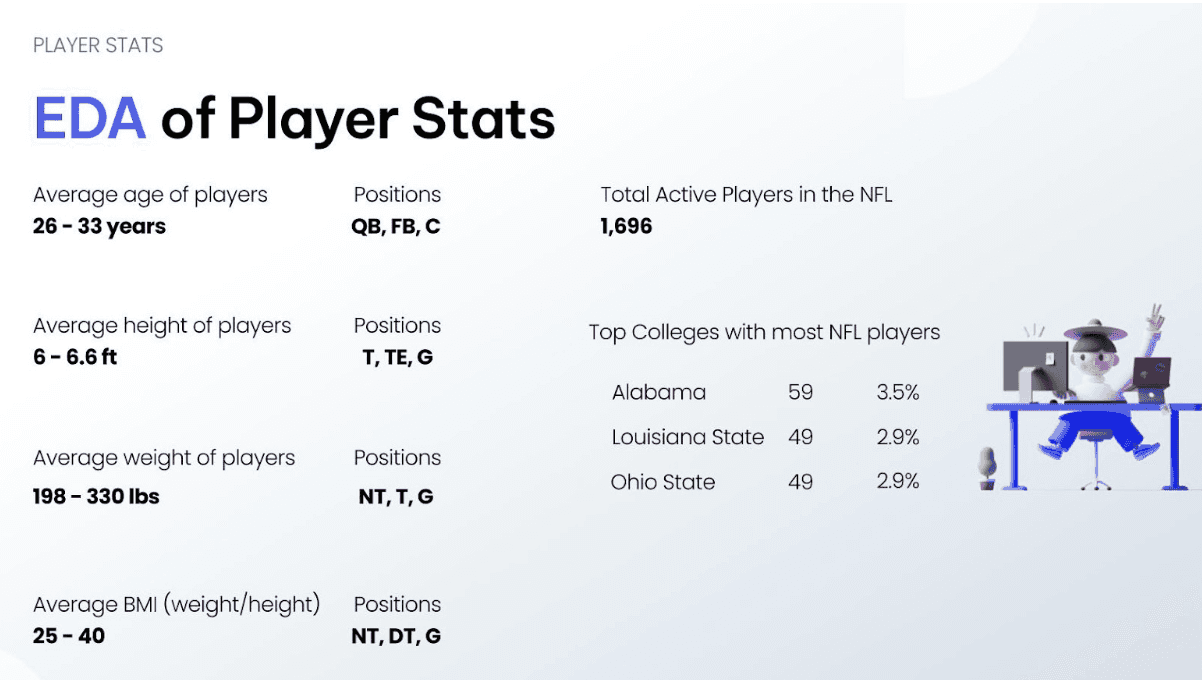
This interactive visualization below gives coaches essential player details, including names, heights, weights, teams, and positions. With this comprehensive information, coaches can make informed decisions when selecting players for a game.
The visualization allows coaches to assess their own teams and analyze opposing teams to anticipate potential matchups. This approach enables coaches to position players based on their height and weight, crucial factors in determining tackling effectiveness. Height and weight are pivotal in a player's ability to bring down opponents, making this visualization an invaluable tool for optimizing player selection and team performance.
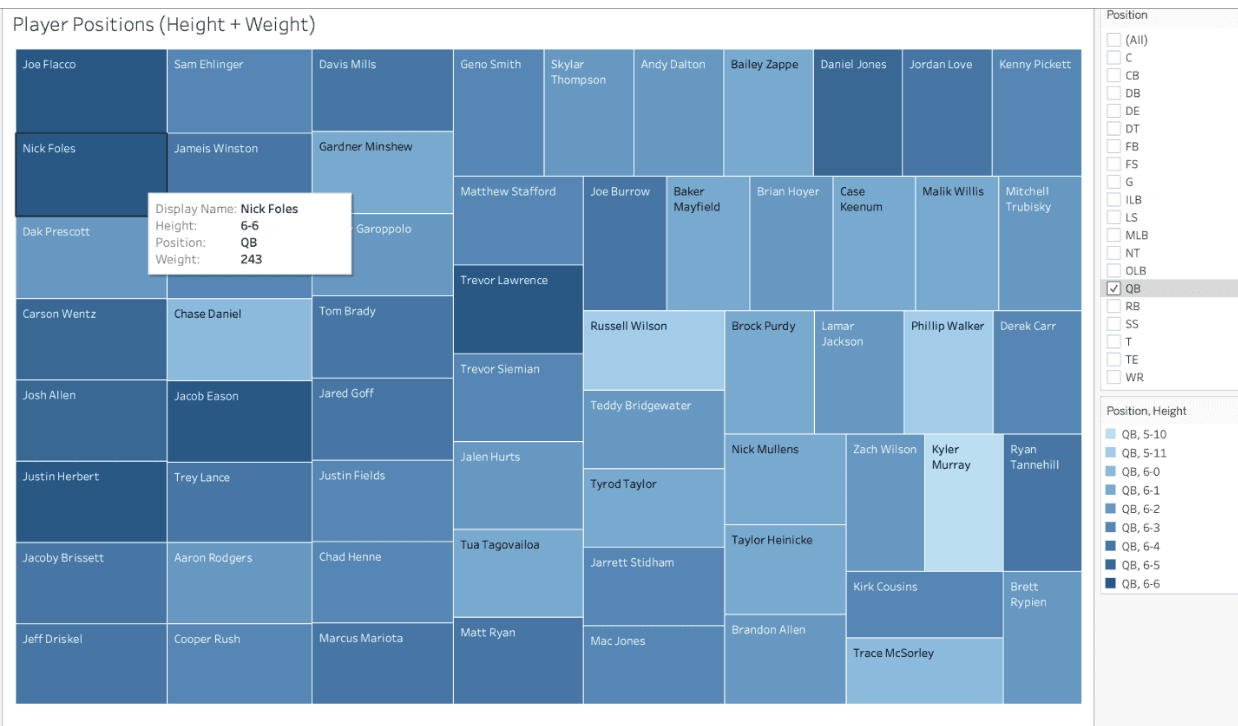
The interactivity and options to toggle would give them an overview of many crucial insights that they could use to figure out their game plan and strategies for each different game. They could always zoom in and focus on one position for example, and see all the available players for that given position, along with important things like height, weight, and BMI.
Conclusion:
Working with the datasets came with its own set of challenges, especially the players dataset, which had missing info like height, weight, and birthdays. I had to get creative and figure out how to clean the datasets, and figure out which ones to use vs which ones to cross reference or combine.
I mostly used descriptive stats and focused on visuals that would actually make sense to a coach during or before a game. The more I explored the data, the more it became clear that what was missing wasn’t more stats but a way to understand how those data points could be useful in a practical setting.
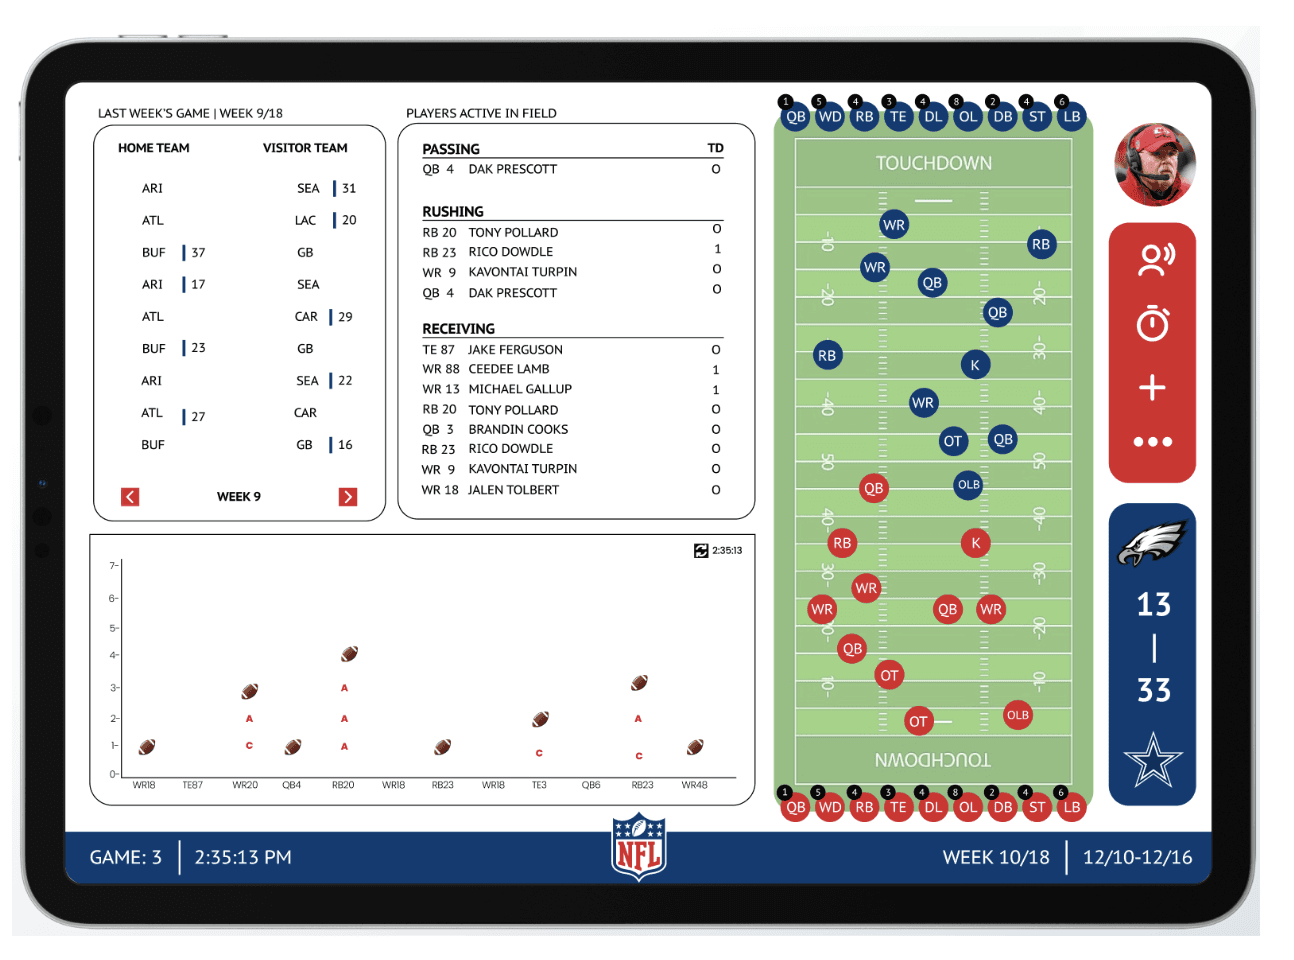
The final dashboard design I created offers coaches a personalized experience with individualized iPads featuring customizable statistics. Coaches would be able to access information on teams, scores, previous game results, points, and winners. The dashboard also provides real-time updates on active players, their positions, jersey numbers, touchdowns, and other insightful metrics, all presented visually and intuitively. For example, knowing where plays usually start on the field (like yard line distribution) can help the coaches figure out how to set up their defense. Visualizing pass completions gives a quick look at what’s working and what’s not. Since everything is filterable by team, position, or game outcome, coaches don’t need to dig through rows of data. They can just toggle what they need and get answers right away. Coaches would also be able to communicate via audio with other coaches so they could strategize without huddling or being in the same spot.
©2025