Data Visualization / Data Analysis / ArcGIS
Urban Dynamics: Walkability and Population Patterns in Los Angeles
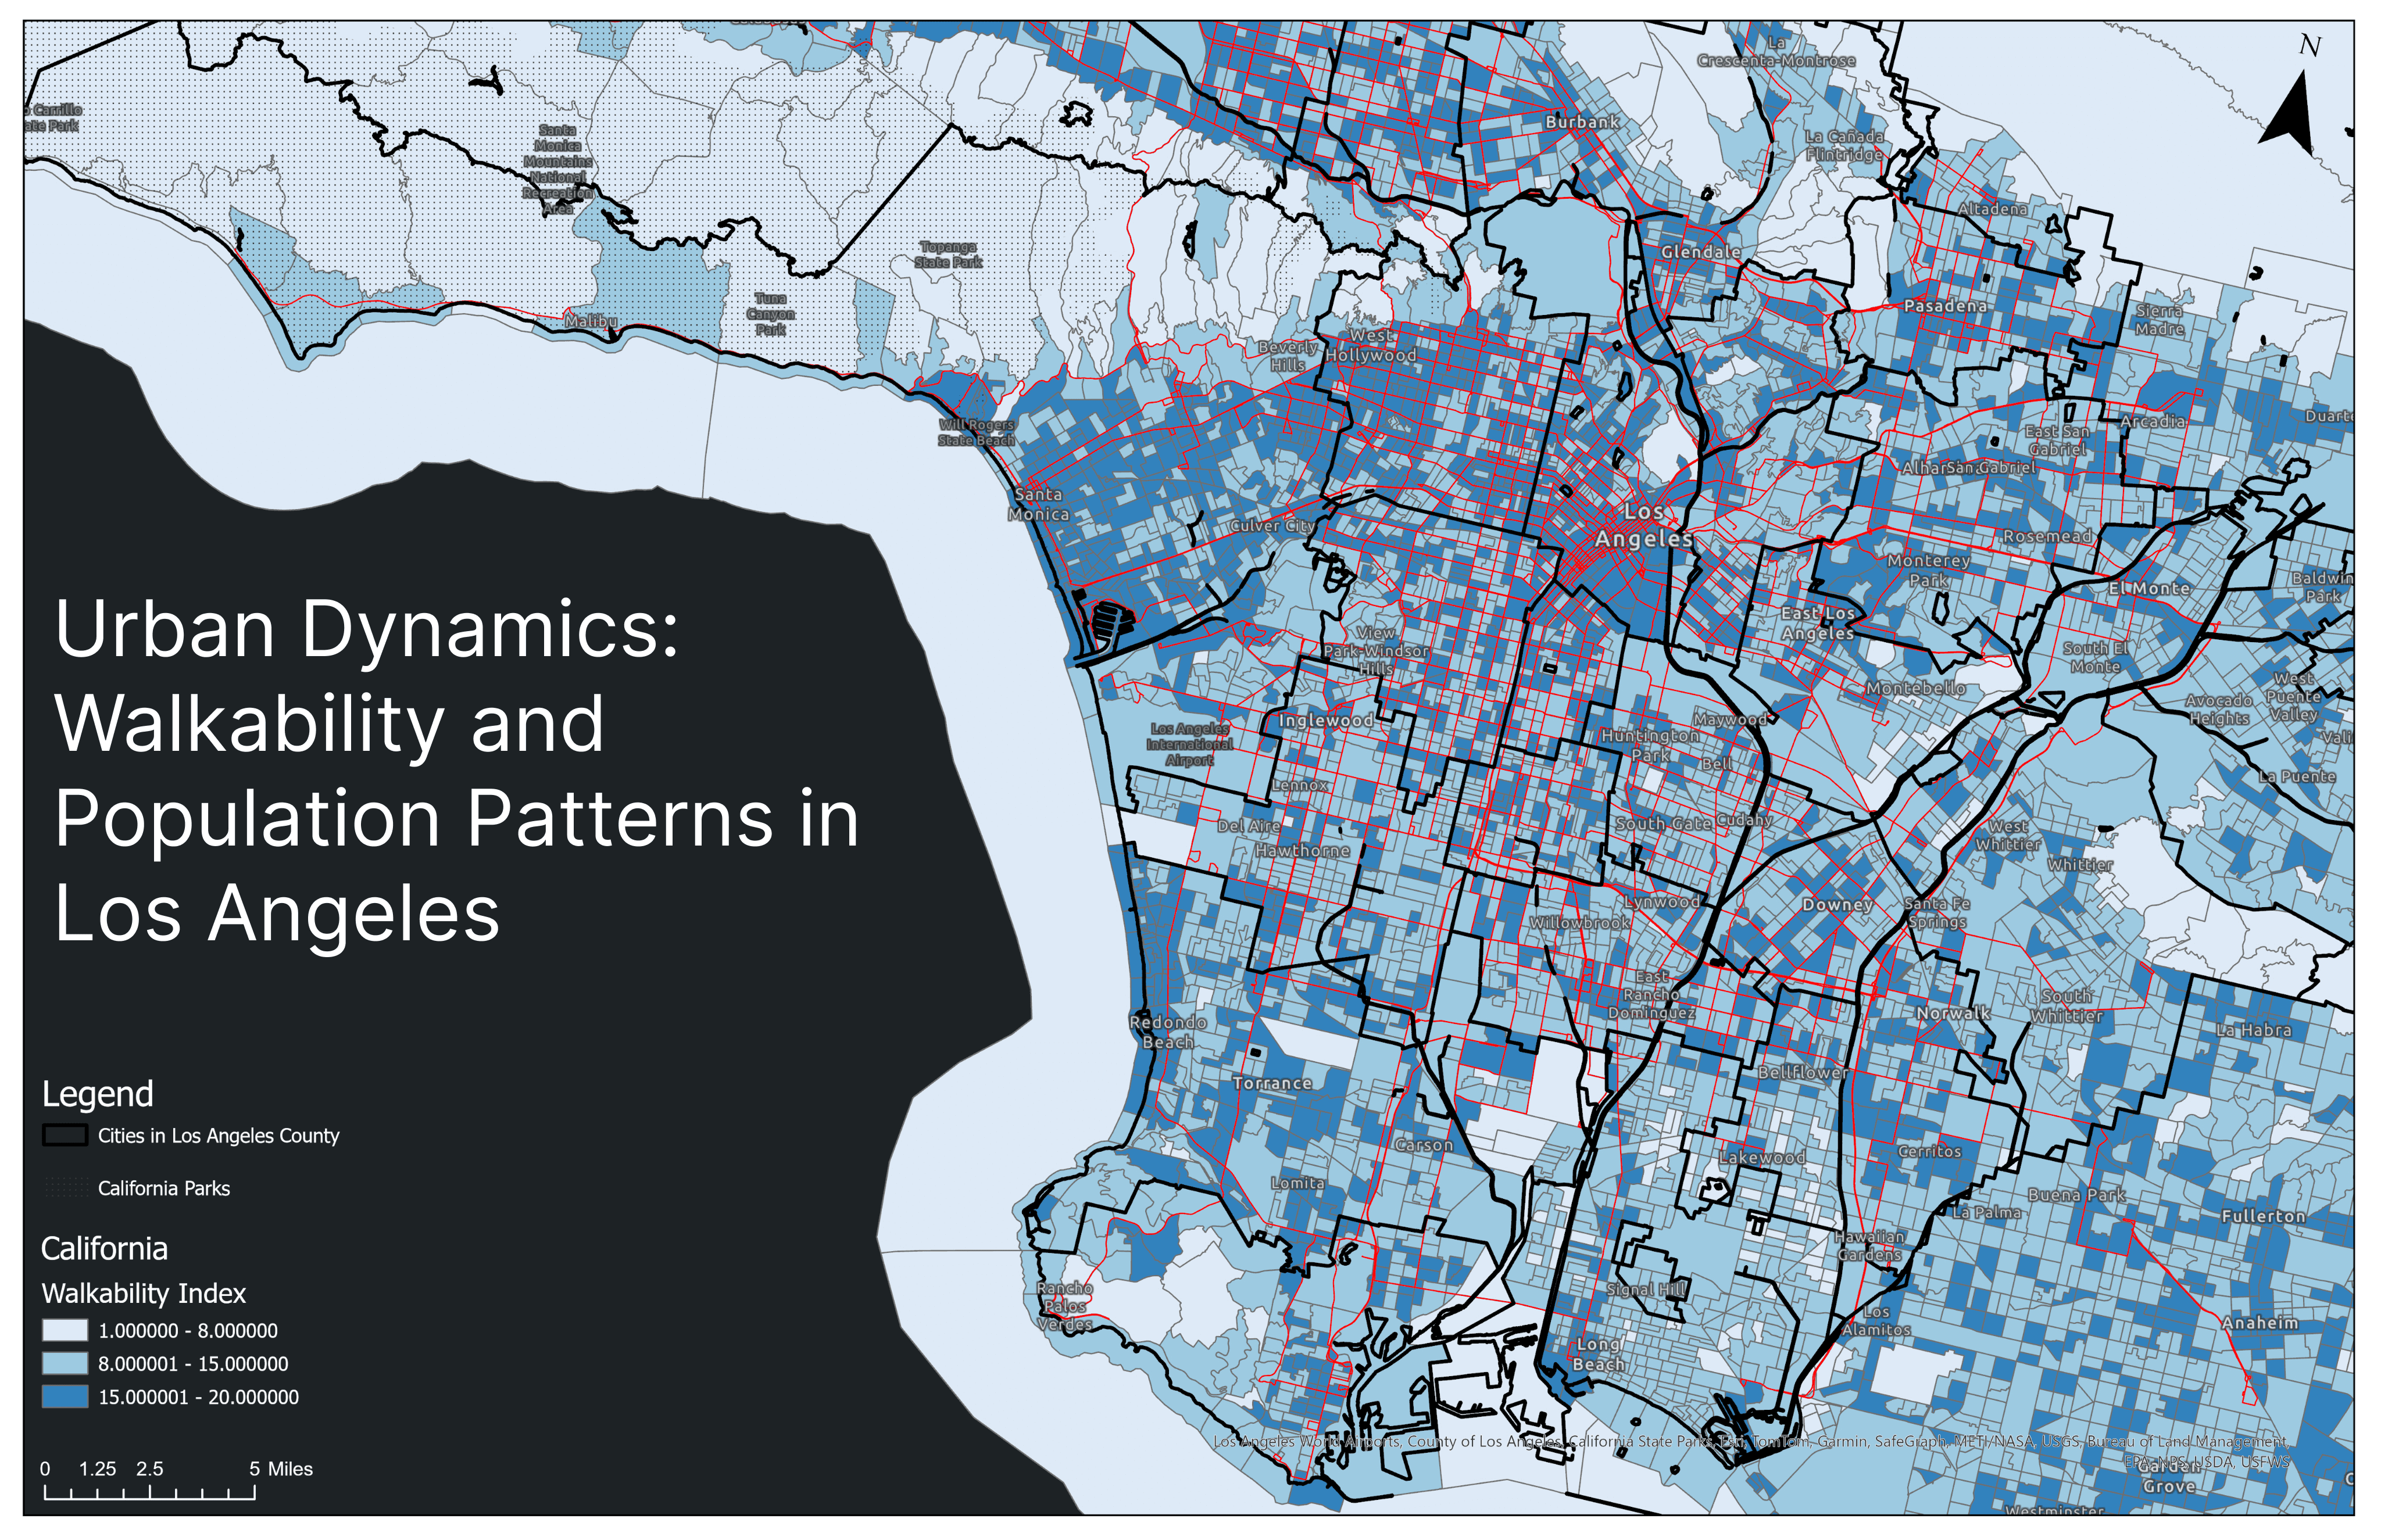
This project explores the relationship between walkability and population distribution in Los Angeles County through a geographic lens. Using public datasets and GIS tools, I created layered visualizations that uncover patterns in urban accessibility and transit infrastructure.
Research Goals
Examine how walkability aligns with transit access and population density
Visualize walkability levels across census blocks and cities in Los Angeles County
Investigate the correlation between public green spaces (parks) and walkability
Experiment with visual techniques to show urban planning challenges and insights
Datasets Used
Los Angeles Census Blocks 2020 – LACounty.gov
Walkability Index – Data.gov
National Parks Dataset – Data.gov
California County Subdivision (Tiger Line Shapefile) – Data.gov
Metro Bus Lines – Los Angeles GeoHub
Methodology
Filtered National Walkability Data
Narrowed my scope to California using state boundaries
Reclassified walkability into low, moderate, and high groups
Overlaid Parks and Transit Lines
Performed spatial joins and used buffers for visual proximity
Found that walkability was typically lower near parks
Overlaying bus lines showed higher walkability along transit corridors
City-Level Aggregation
Dissolved block-level data to city boundaries for macro-level analysis
Used white outlines to layer cities over census blocks for dual-scale insights
Supplemental Charts
Created scatterplots and bar charts to visualize population-walkability trends
These visualizations filled in for hotspot analysis which crashed due to processing limits
Tools Used within ArcGIS:
geoprocessing tools and techniques
Spatial Join
Dissolve
Symbology
KML Overlay
Final Map Visualization
Displays walkability index and population trends overlaid with transit infrastructure and city outlines.
Insights & Final Thoughts
Areas with high walkability strongly align with denser transit infrastructure, particularly near downtown LA.
National parks and natural areas do not correlate with high walkability, as these regions lack surrounding infrastructure.
City level aggregation provides broader policy insights compared to individual census blocks.
©2025